


Summary
- S&P 500 index recently made a new lifetime high of 3,756.12.
- S&P 500 index has also broken its trading range of 3,225.00 to 3,602.50.
- S&P 500 benchmark index delivered ~70.40 percent returns after the March 2020 COVID-19 crash.
- S&P 1500 index is trading in a rising wedge pattern on the weekly time frame chart and also getting support from the 50-period simple moving average.
- S&P 1500 made new all-time highs on the back of stimulus packages, encouraging developments on Covid-19 Vaccine, and the US presidential election results.
- CBOE Market Volatility Index is trading in lower highs and lower lows formation.
The benchmark index S&P 500 has broken the ‘Rectangle Pattern’ at 3,602.50 level and prices made a new all-time high. After consolidating in the range for more than 3 months, the index registered a decisive breakout that suggests a change in trend from sideways to bullish.
S&P 500 Weekly Technical Chart
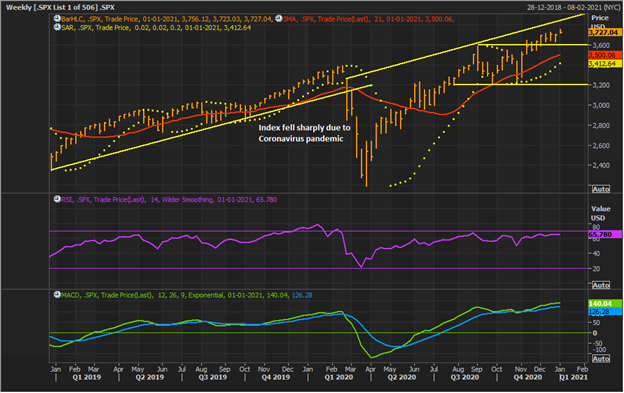
Source: EODHD/Others, Thomson Reuters; Analysis: Kalkine Group
S&P 500 index made a lifetime high of 3,393.52 in February 2020. Thereafter, due to the COVID-19 pandemic, the index remained under pressure and made a low of the 2,192 level in March 2020.- The index has broken the upward trend line during this move and fell from its lifetime high and made a low of 2,192 on March 23, 2020. We saw a sharp sell-off in the index from the end of February 2020, which continued till the end of March 2020. Thereafter, the index has gained ~70.40 percent from March 2020 low to the present high of 3,756.12 (as on 29 December 2020). On the weekly time frame chart, the index price is trending upward forming a series of higher tops and higher bottoms with strong positive candles and seems supportive for further upside movement.
At present, the index is trading above the 21-period exponential moving average (EMA), suggesting an uptrend. Moreover, momentum oscillator RSI (14-period) is sustaining above 60 levels and indicates that the bulls may further retain the control till the 3,860.50 level.
S&P 1500 Price Action Summary
Another benchmark index S&P 1500 is trading in a rising wedge pattern for the past few months on the weekly time frame chart. S&P 1500 includes stocks from S&P 400, S&P 500 and S&P 600 indices.
S&P 1500 index has started the year on a positive note and made a lifetime high of 775.61 on February 02, 2020. It witnessed a sharp downside movement in March 2020 and touched a low of 495.57 level.
On the back of stimulus, encouraging developments on the Covid-19 vaccine, and the US presidential election results, markets gained an upward trajectory and magaed to make a new all-time high. The Index took the support of the lower band rising wedge pattern at 775.50 and recovered from there. The bulls are expected to remain active further till the 892.50 level.
S&P 1500 Weekly Technical Line Chart
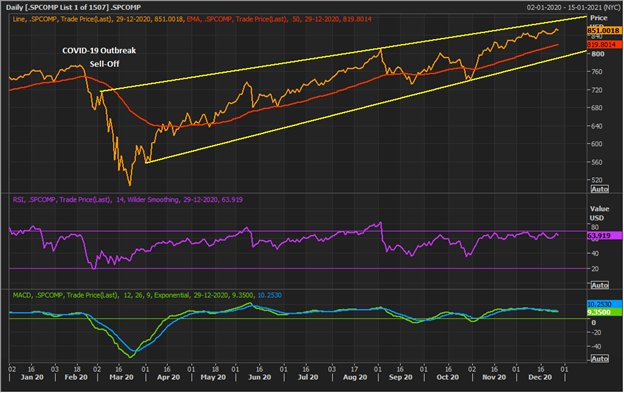
Source: EODHD/Others, Thomson Reuters; Analysis: Kalkine Group
The index is well placed above its 50-period SMA, which bodes well for the uptrend. The momentum indicator Moving Average Convergence Divergence (MACD) has surpassed its previous high which signals strength in price. Furthermore, momentum oscillator RSI (14-period) is above 55 levels, which is a positive sign for the index.
CBOE Market Volatility Index Weekly Chart
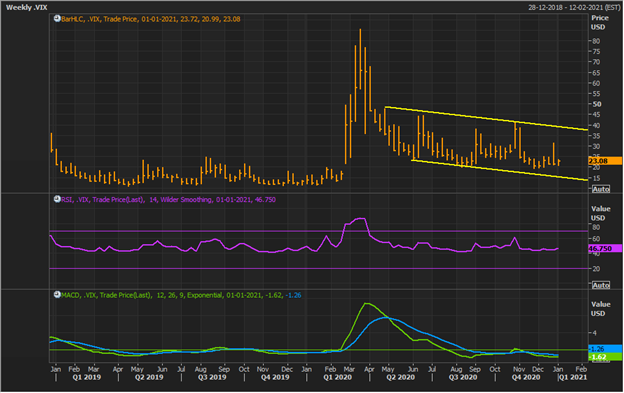
Source: EODHD/Others, Thomson Reuters; Analysis: Kalkine Group
CBOE Market Volatility Index is consolidating in the range of 19.80 to 40.50 and forming a descending channel on the weekly time frame chart. In general, the VIX index has an inverse relation with the equity price trend. The VIX index is struggling to make a new high suggesting a weakness at the current levels.
The VIX index is trading in lower highs and lower lows formation, which indicates the possibility of a correction in the index. It has rallied from its low of 13.38 in February 2020 to a high of 85.47 levels in March 2020. The index managed to bottom out and witnessed an impressive recovery from the lows.
The momentum oscillator RSI (14-period) is trading at ~46.75 level which shows that the momentum of the prices is currently neutral. Moreover, momentum indicator MACD is forming a negative crossover and trading below the centerline. According to the chart analysis, the key support level for VIX is placed at 15.00, while, on the upside, the key resistance level is at 35.80.
To summarise, considering the above-presented chart patterns and technical outlook, the S&P 500 index is trading in the positive territory, and the bulls seem to be in action for the near short term. Moreover, if the S&P 1500 index prices sustain above the crucial support level, then the next important resistance level of 892.50 may be approachable in the coming months.
