
 AUS
AUS
 NZ
NZ
 UK
UK
 CA
CA
 USA
USA
 IND
IND







Bitcoin has been under a bull run with prices hitting new record highs almost every week and in 2021 the prices have already scaled above the USD 40,000 mark and registered a new all-time high of USD 41,100.
To Know More, Do Read: Bitcoin hits new all-time high of $41,100 within 12 hours after breaching $40k
The surge in Bitcoin prices is not unprecedented for long-term BTC watchers, as the digital currency has had burst of bristling rally in 2017 before. This time the rally has been on the back of excessive liquidity, geopolitical instability caused by COVID-19 outbreak and healthy institutional participation.
However, post surging to the record of USD 41,962 the currency saw a 10 per cent correction and is trading at USD 37,621 levels (as on 11 January 2021, AEDT: 11:58AM).
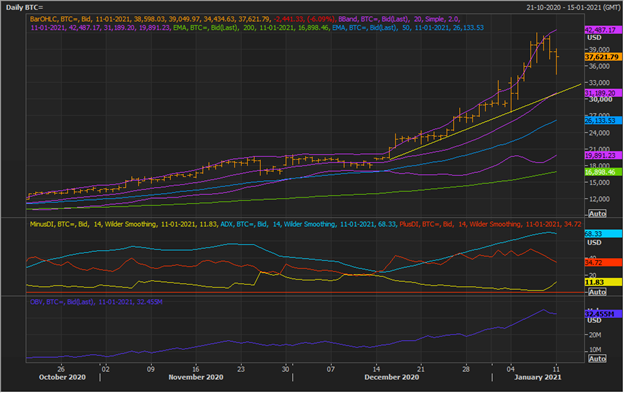
Bitcoin Daily Chart (Source: EODHD/Others Eikon Thomson Reuters)
On following the daily chart, it could be seen that the currency is now under consolidation after witnessing a wide bar over increased volatility. At present, the up-trend for the currency is intact, with the prices comfortably above the 50- and 200-day EMAs.
- During its previous trading sessions, Bitcoin had attempted a volatility breakout with prices crossing the +2 Standard Deviation of the 20-day simple Bollinger Band®.
- Currently, the currency is holding the volatility break, which could seed bullish sentiments ahead.
- The upwards sloping short-term trend line is overlapping with mean value of the Bollinger Band®, and this zone could act as a support.
- The other intermediate support for the currency is at the -2 Standard Deviation, which is trailing near the 200-day EMA; thus, is decisive in nature, and a breach & price action below the same could seed bearish sentiment.
- Also, it should be noted that the price is showing a multiple series of outside bar followed by an inside bar, high of which is later crossed to seed bullish sentiments, suggesting that at present bulls still dominate the front.
- The rally in prices is further suported an upward sloping On Balance Volume (or OBV) and ADX.
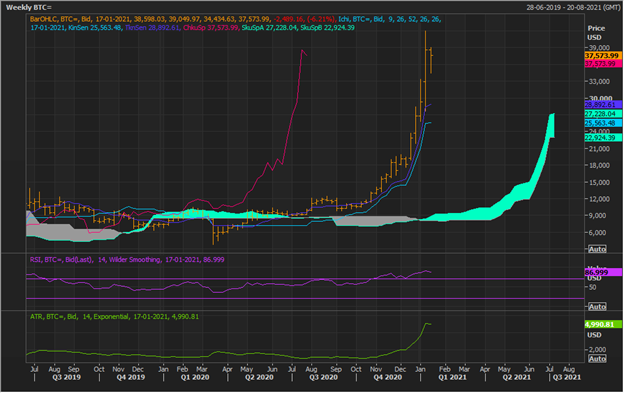
Bitcoin Weekly Chart (Source: EODHD/Others Eikon Thomson Reuters)
On following the weekly chart, it could be seen that the currency is currently trading above Span A (Ichimoku Kinko Hyo) with a positive crossover between the conversion line and the base line, suggesting that the major trend is an uptrend and strong bullish sentiments are prevailing at the moment.
- Also, Span A (mean value of the conversion line and the base line) is trading above Span B (or the mean value of the 52-week high and low, giving comfort to the bulls. The sky-blue cloud area might act as immediate support for the currency.
- A break and price action below the sky blue cloud could seed bearish sentiments ahead.
- Both the Relative Strength Index and the Average True Range are moving in tandem with the price action, suggesting that the upward trend is in strength.
