


Summary
- Vulcan Energy Resources Limited (ASX:VUL) has been under a bull rally with the stock surging eightfold in just few trading sessions.
- The stock gained considerable momentum post announcing the appointment of Mr Jochen Rudat into the business development team on a consultancy basis.
- Mr Rudat, who was one of the first employees for Tesla in the sales & marketing department across Europe, would join the sales and development team of VUL on immediate basis.
- The market has reacted sharply to the latest announcement of the Company, and the stock is making bullish patterns on the charts.
Vulcan Energy Resources Limited (ASX:VUL) has been a stallion so far with the share price skyrocketing from $0.150 (intraday low on 30 March 2020) to the present high of $1.350 (intraday high on 25 September 2020), which marks an eightfold increase in the price.
While the stock has been in a consistent uptrend and an impeccable rally, its price witnessed a gap up on 25 September 2020 after the Company made an announcement concerning the appointment of Mr Jochen Rudat - ex-Tesla Director for Central Europe as a consultant.
The Company suggested that Mr Jochen Rudat would join the business development team with immediate effect on a consultancy basis.
Mr Rudat was one of the first employees for Tesla in the sales & marketing department across Europe with Mr Rudat having a background of building a team of 250 employees while taking care of the launch of various Tesla models in the region.
In his ten-year tenure with Tesla, Mr Rudat was reporting to Tesla CEO – Elon Musk, and prior to working for Tesla, Mr Rudat worked for BMW, Kia, and Porsche. Most recently, he has been the Chief Sales Officer for Automobili Pininfarina – an Italian luxury car maker.
The market has reacted sharply to the latest announcement, and the stock looks under a bullish sentiment on charts.
VUL On Charts
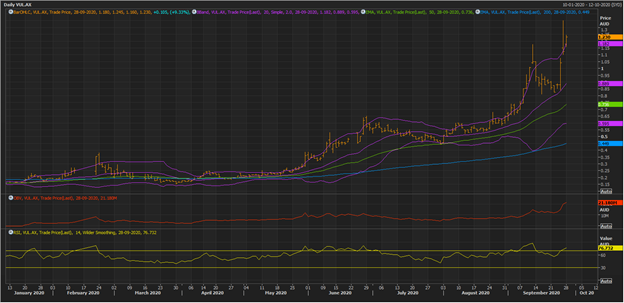
VUL Daily Chart (Source: EODHD/Others Eikon Thomson Reuters)
On following the daily chart, it could be seen that the stock is currently on an uptrend and strong momentum with its prices spiking above the +2 Standard Deviation during the trading session on 25 September 2020, and further the bullish momentum continued on 28 September 2020, with the shares up 10.22 per cent (as at AEST: 1:05PM).
- It could be seen that before the breakout, the stock witnessed a volatility squeeze with its Bollinger band narrowing ahead of a rush in the stock, reflecting large participation behind the rally, which could also be confirmed by witnessing a sudden spike in the On Balance Volume (or OBV).
- Furthermore, the 14-day Relative Strength Index (or RSI) is also moving in tandem with the price action.
- The major support for the stock is around the mean value of the Bollinger band, which is currently overlapping with the 50-day exponential moving average, followed by the -2 Standard Deviation, which is currently overlapping with the 200-day EMA.
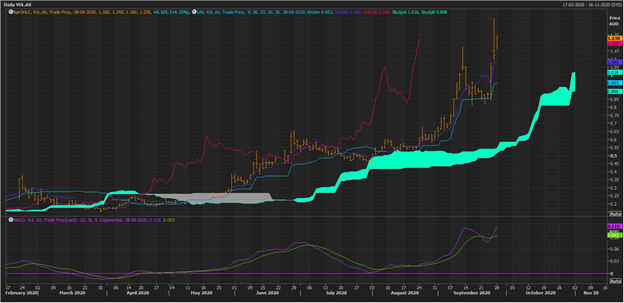
VUL Daily Chart (Source: EODHD/Others Eikon Thomson Reuters)
On applying the Ichimoku Kinko Hyo on a daily chart, it could be seen that the stock is currently trading above Span A with a positive crossover between the conversion line and the base line, suggesting that the major trend is an uptrend.
- Moreover, Span A, which denotes the mean value of the conversion line and the base line, is itself trading above Span B (or the mean value of the 52-period high and low), reflecting on the strong bullish sentiment around the stock.
- Also, the spread between the conversion line and the base line is also expanding, reflecting the strength in the primary trend.
- As the Ichimoku technique is a trend-following system, the signals from the indicator tend to change less with a slight correction. However, the major support for the stock is at the sky blue area, which should be monitored, as a break and sustain below the same could seed bearish sentiments and vice versa.
- Also, it should be noticed that the recent spike in prices coupled with a large consolidation has considerably reduced the spread between Span A and Span B, suggesting that the stock might enter a phase of temporary correction.
- The 12,24,9 MACD indicator is showing a positive crossover with the signal line crossing the base line from below.
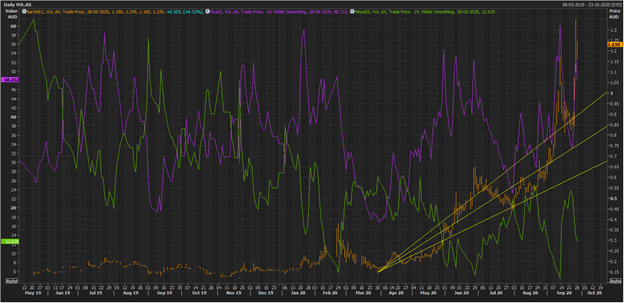
VUL Daily Chart (Source: EODHD/Others Eikon Thomson Reuters)
On further following the price action on the daily chart, it could be seen that the current support area is around the recent spike point of the plus Directional Index, which is also pointing the support zone to be around the level suggested by the Ichimoku cloud, as both Directional Index and Ichimoku are trend-following in nature.
- The pair of plus of DI and minus DI is also showing a large spread with one another after coming closer to each other with the recent price correction.
- Post connecting the starting point of the rally to the highest point via a Fibonacci fan, the primary support of 1/3 is coming around the recent extreme of the Plus DI, a break and sustain below the same could attract bearish sentiments ahead and vice versa.
In a nutshell, the market has reacted sharply to the recent announcement of the Company with the stock gaining a considerable momentum on ASX.
Also, the recent rally has increased considerable volatility in the stock, with which, the risk of whiplash has also increased.
