


Source:Evgeny_V, Shutterstock
Summary
- Recent fall in SHFE Nickel price backed by demand concerns arising due to slow economic recovery from the pandemic.
- SHFE Nickel has broken the rising channel support on the daily chart.
- Now, the Nickel prices are trading below the 21-Period SMA and Parabolic SAR indicator, acting as the resistance for the commodity.
- Nickel prices are facing the resistance of a horizontal trend line on the weekly chart and the MACD indicator has formed a negative crossover.
In the last couple of months, SHFE Nickel prices have rushed on account of stimulus packages announced across the globe due to the Covid-19 pandemic which pushed the nickel prices to almost two-year high of CNY 149,040. Positive developments around COVID-19 vaccine also helped the bulls to push the prices up. The strong demand for electric vehicles from China as the country moves towards green energy also helped to boost the demand for nickel higher. However, currently, the SHFE nickel prices are under pressure on concerns of economic recovery from the pandemic, hitting the market sentiment.
Now let us gauge the market participants mood via technical charts
Technical Outlook on SHFE Nickel prices
SHFE nickel price has been under a steep rally from the low of CNY 114,500 made on November 2020 to hit a two-year high of CNY 149,040 on 22 February 2021, a gain of ~30 percent in five months. Currently, the prices have been under pressure from the recent high and made a low of CNY 118,130 on 19 March 2021, a decline of ~26 percent in the last few weeks due to massive sell-off from higher levels.
SHFE Nickel on a daily chart
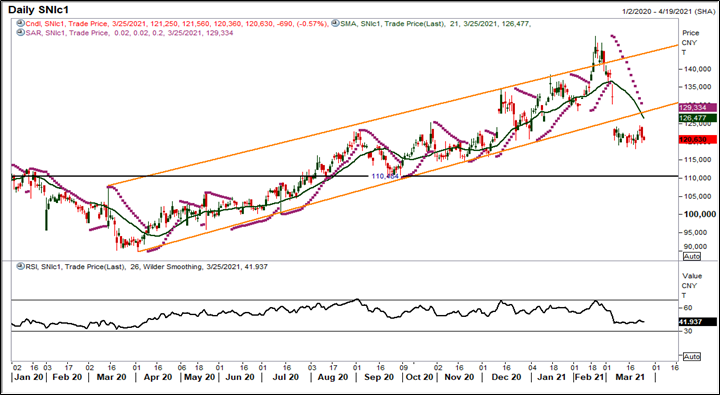
Source: EODHD/Others, Thomson Reuters; Analysis: Kalkine Group
On the daily time frame chart, SHFE nickel price has broken the lower band of its rising channel pattern at CNY 126,120 level and made a new low of CNY 118,130, putting the bears in the driver seat. Besides, the price is trading below its 21-period SMA, acting as a crucial resistance zone at the lower end of the channel pattern. If prices continuously manage to trade below the 21-period SMA, then chances are that the prices might tumble towards the horizontal trend line support level (black color line in the above chart). Nickel price is well placed below its Parabolic SAR indicator and appears supportive for the downtrend. Furthermore, the momentum oscillator RSI (14-period) is trading at ~42 levels, indicating a neutral to a positive trend for the commodity. Now the prices are consolidating in the range of CNY 118,130-124,440 levels for the past three weeks.
SHFE Nickel on a weekly chart
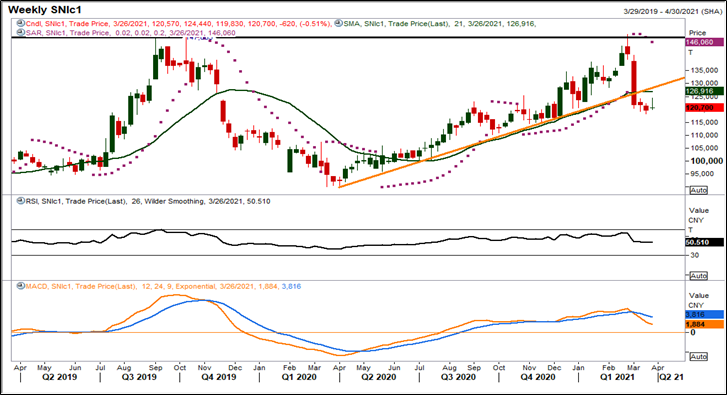
Source: EODHD/Others, Thomson Reuters; Analysis: Kalkine Group
After a tremendous up move, SHFE nickel prices have faced strong resistance of the horizontal trend line (black color horizontal line in the above chart) at CNY 148,096 level on the weekly chart. Price has broken down from its upward sloping trend line at CNY 126,450 level on the weekly chart.
Currently, nickel is trading below the 21-period SMA, which acts as a crucial resistance zone for the commodity. Moreover, the momentum oscillator RSI (14-period) is trading at ~50 levels, which suggests sideways to downside momentum. The momentum indicator MACD is also showing a negative crossover, indicating that if there is a correction, then the bears may remain in the action till the further support level.
Based on the current demand concern and technical outlook, the charts suggest that SHFE nickel is in a bearish phase. Currently, prices are trading in a downward trajectory and facing selling pressure at higher levels. The chart patterns suggest that there might be some more correction expected in SHFE nickel if the price remains below the support levels in the coming weeks.
