
.jpg)


Summary
- Gold and Silver spot multi-contributor prices are showing great signs of recovery from lower levels. Gold spot prices shot up on Friday to USD 1929 up by 1.87% compared to the previous day, while Silver spot prices rose sharply by 5.51% and settled at USD 25.12.
- Precious metals prices are holding grounds as they are trading above 21-period simple moving averages on a weekly time frame chart.
- Spotting ABC corrective pattern on Gold and Silver technical charts rules out the consolidation phase and further support short to medium-term bullish stance.
- Trump’s COVID virus diagnosis and Stimulus Package seems to be further supporting gold and silver prices.
- Dollar index price is inversely correlated to Gold and Silver. It had had suffered losses post-March COVID period which gave a boost to gold and silver prices.
Gold Spot Multi-Contributor (XAU/USD) on Technical Chart
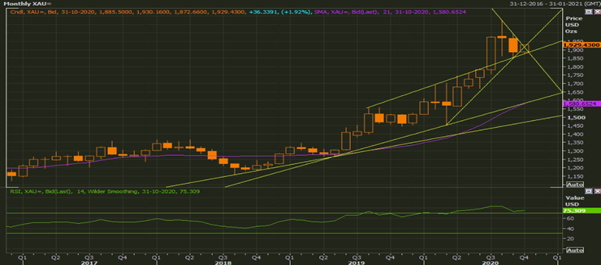
Gold Spot Multi-Contributor (XAU) Monthly Chart (Source: EODHD/Others Eikon Thomson Reuters)
Gold prices were on an upswing on 09 October 2020, and closed at USD 1929.43, up by 1.87%. Gold is on a recovery mode in the first week of October after going through a steep downside technical correction up to USD 1848.2 in September 2020.
Prices have taken the support of the upper trendline at USD 1872 and sustaining above USD 1920 level which also acts as a strong resistance that suggests long participants are taking control over short. Gold prices are now attempting USD 2038.9 zone, which is its next resistance level on a monthly chart time frame.
Prices on Friday gave a fresh triangle breakout on monthly charts which might support the bull run in the medium to long term.
RSI (14) is hovering at 75 which suggests prices are trading in a primary bull trend and at over bought levels.
21 period SMA is trading at USD 1580.65 on monthly charts.
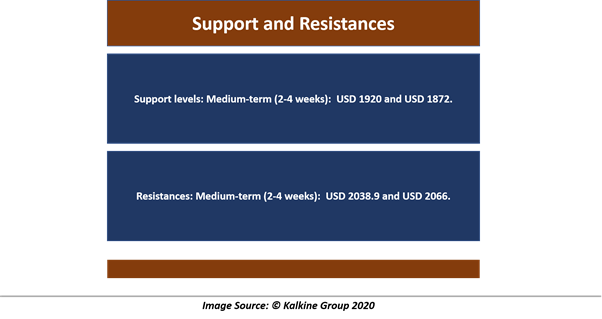
Conclusion: Gold Prices are likely to stay in the upper trend trajectory.
Silver Spot Multi-Contributor (XAG/USD) on Technical Chart
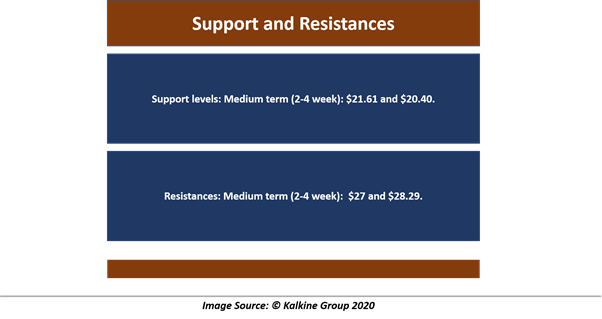
The monthly chart of the silver spot multi-contributor (XAG/USD) shows upward momentum from strong support levels of USD 21.6 and USD 23 further suggesting prices may move upwards in the coming months.
Silver price settled at USD 25.12 on Friday up by 5.51% compared to the previous day close.
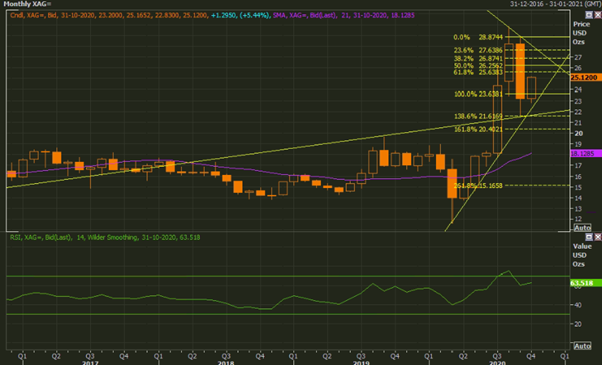
Silver Spot Multi-Contributor (XAG/USD) Weekly Chart (Source: EODHD/Others Eikon Thomson Reuters)
After witnessing a sharp fall in September 2020, Silver is now giving signs of a strong reversal to the upside, taking support from the downward trendline.
Prices are trying to rebound after taking the support of USD 21.61 level which also lies at 138.6% Fibonacci retracement levels.
Technical Indicators: RSI (14) is hovering around at 63 on a monthly time frame which suggests prices are trading in a primary bull trend, and hovering in the overbought levels.
21 period SMA is trading at $18.12 on a monthly time frame chart.
Conclusion: Silver prices are likely to continue its northward direction, breach of $28.29 level by upside will lead the prices near to all-time highs.
Gold & Silver Holding Grounds on Weekly Charts
Gold and silver spot prices are holding grounds after rebounding sharply to the upside direction from 21-period simple moving averages which indicates prices came up to its mean averages from recent highs and are now again continuing upward primary trend rally.
To know more on trendline read here.
September Has Caused Panic Selling in Gold & Silver
Gold and silver prices haunted everyone in the month of September 2020. Prices broke August 2020 lows creating an impression in the mind of traders that market will go down further which might have caused market participants to create fresh short positions or panic selling exit from their buy positions.
Gold & Silver Price Consolidating?
Gold and silver prices have recently completed ABC correction pattern on technical charts which clearly rule out the consolidation phase in gold and silver. After the successful completion of the pattern, prices shot up towards the primary trend.
What is ABC Corrective Pattern:
ABC pattern is a correction zig-zag pattern identified in the strong upward trend. In ABC pattern, point A signifies prices down sharply after a price rise. Point B indicates a price rebound from lower point A but making lower highs. Point C indicates a move downwards and cuts the previous lows making lower lows.
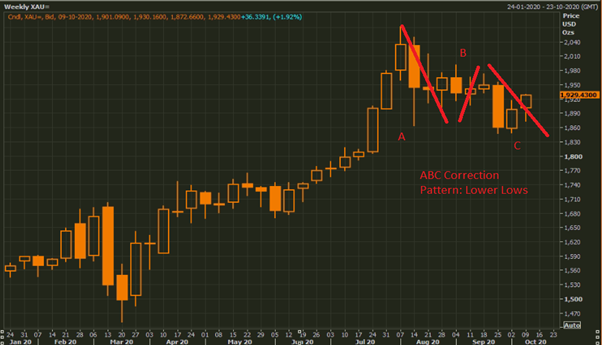
Gold Spot Multi-Contributor (XAU/USD) Weekly Chart (Source: EODHD/Others Eikon Thomson Reuters)
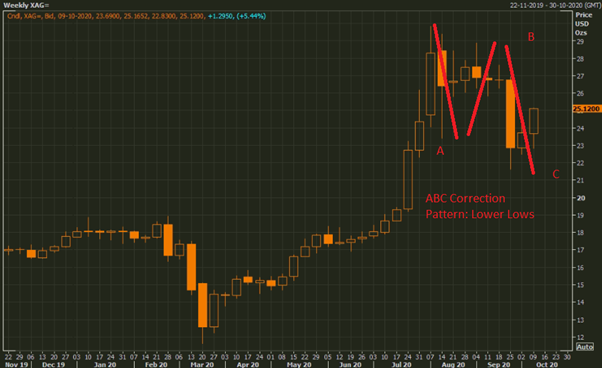
Silver Spot Multi-Contributor (XAG/USD) Weekly Chart (Source: EODHD/Others Eikon Thomson Reuters)
It is evident from the above charts that Gold and silver spot multi-contributor prices completed ABC formation and are now heading towards an existing upward trend.
Read here for more information on Elliot Waves.
Stimulus Package & Trump’s COVID-19 Diagnosis: Big Surprises For Gold & Silver
Events in the early weeks of October, like rumour of Negotiating on Stimulus packages and Trump’s COVID-19 diagnosis gave the confidence to long side traders of precious metals. However, the US government later announcement of the delay in the Stimulus package by three weeks, and trump’s return to the white house add fire to the volatility of gold and silver prices.
Stimulus packages are the supporting pills for ongoing bullish trend in precious metals.
Must Read: How many stimulus packages have been launched in Australia during COVID-19?
Fundamental Reasons to be bullish on Precious Metals in the rest later half months of 2020.
The recent event of President Trump testing positive for COVID virus reminds everyone that the virus can affect any person.
The charts suggest that the gold and silver prices would likely continue their bull run considering current policies putting pressure on the US dollar which is down from March period to date. The expected Stimulus package on COVID by US Government might put pressure on US Dollar index prices which are inversely correlated to Gold and Silver. US dollar index already had suffered losses post-March COVID period giving a boost to gold and silver prices.
Also Read: The fuelling demand for Gold
