
.jpg)


Summary
- Copper and Zinc prices are trading in a Symmetrical triangle pattern, while Nickel prices are moving in an upward channel.
- After witnessing a dull first quarter this year, base metal prices shot up significantly following the major technical breakouts.
- Copper and Zinc prices are trading near strong resistance levels while Nickel has already corrected from the major resistance levels.
- Copper prices are trading at CNY 58,260 per ton while Zinc prices are hovering around CNY 21,525 on Shanghai Futures Exchange (SHFE).
- Prices of metals like Copper, Nickel, and Zinc are following their existing 5-year monthly average price seasonality.
Copper’s Price Action Summary:
Copper prices are trading in a perfect symmetrical triangle pattern on a quarterly timeframe chart on Shanghai Future Exchange. It started the year with a bearish tone and gave negative quarterly closing, near to the decade’s lows. However, prices were unable to sustain at the lower levels and recovered sharply in the rest of the quarters of 2020 and recently trying to test its 8-year peak.
From the technical standpoint, RSI (14-period) has surged to 59 levels from near to oversold zone which indicates spur buying came from lower levels and now prices are trading in an upward trajectory.
Prices are also sustaining well above 21-period and 50-period SMA, which indicates bulls are currently dominating the commodity prices.
Copper Prices Analysed on Chart
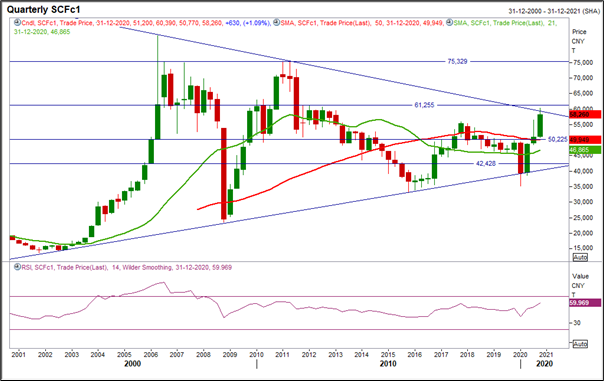
SCFc1 Copper Quarterly Chart; Source: EODHD/Others, Thomson Reuters
Key Levels to Watch:Copper prices are currently trading in aconverging triangle formation. Let us have a look at the key levels for Copper.
Key Support Levels: On the lower side, the CNY 50,225 level acts as a strong support level which also lies near to 50-period SMA. However, a breakout of the CNY 50,225 level might further take prices down to the next support level of CNY 42,428, going by the chart pattern analysis.
Key Resistance Levels: On the upper side, CNY 61,255 is the immediate resistance level; however, if the prices sustain above CNY 61,255, the bulls might further get strength to push the the prices upto CNY 75329 in the coming months.
5-Year Monthly Average Copper Price Seasonality
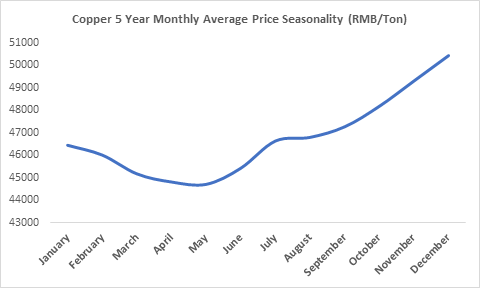
Chart Source: Kalkine Group, Data Source: EODHD/Others Eikon, Thomson Reuters
Copper future’s 5-year monthly price seasonality clearly shows that the prices might witness sluggishness from January 2021 onwards till May. Copper prices made a low in the first quarter of 2020 but soared rapidly thereafter. So, it can be concluded from the above chart that current copper future prices are following its 5-year monthly price seasonality pattern.
Zinc’s Price Action Summary
Like Copper, Zinc prices are also trading in a symmetric triangle pattern on Shanghai Futures Exchange on a quarterly time frame chart. Zinc prices took support from the upward trendline in the first quarter of 2020 which is also the lower band of the triangle formation. Prices gave a breakout signal in the third quarter of the year and broke the resistance level of CNY 17,456. Now it might be heading towards its next resistance level of CNY 22874.
RSI (14-period) is hovering around 53 levels after it surged from oversold region which indicates bulls are controlling the market sentiments. Prices are also trading above 21-period and 50-period SMA, further confirming the northward trend of the commodity prices.
Zinc’s Technical Chart
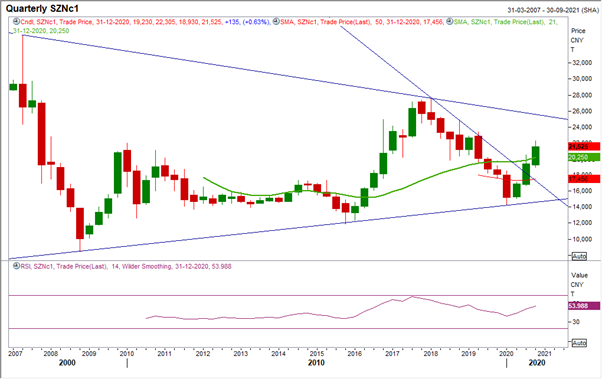
SZNc1 Zinc Quarterly Chart; Source: EODHD/Others, Thomson Reuters
Also Read: A Bird’s-Eye View On Copper Outlook!
Key Levels to Watch
Support Levels: On the lower side, the CNY 20,219 level acts as a strong support which also lies near the 21-period SMA. However, a breakout of the CNY 20,219 level might further take prices down to their next support level of CNY 17,456.
Resistance Levels: On the upper side, the CNY 22,874 level is the immediate resistance level; however, the sustainability of prices above CNY 22,874 might further advance the price up to CNY 25013 in the medium-term.
Zinc Monthly Average Price Seasonality
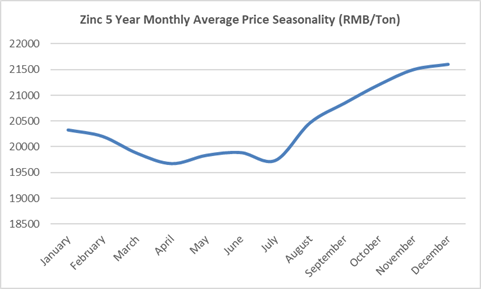
Chart Source: Kalkine Group, Data Source: EODHD/Others Eikon, Thomson Reuters
After taking cues from the above 5-Year Monthly price seasonality, one can notice that the Zinc prices started moving upwards from the mid of the year and continued their bull run till year-end. However, prices might catch a bearish tone from January 2021 onwards, considering the above chart readings. The current price trend of zinc confirms that it following its existing seasonality pattern.
Nickel Price Study Using Technical Analysis
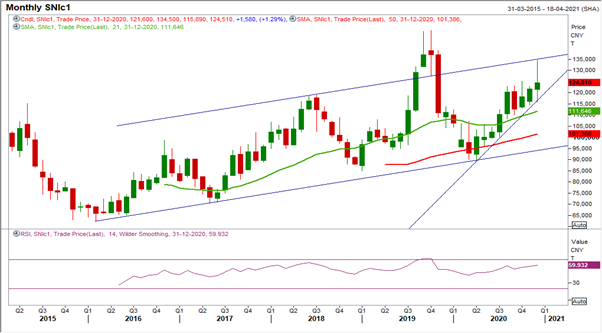
SNIc1 Nickel Monthly Chart; Source: EODHD/Others, Thomson Reuters
Nickel prices are currently trading in an upward trajectory of ascending channel on the Shanghai Futures Exchange on a monthly chart. Prices are consistently moving in a zig-zag formation creating ambiguity regarding the overall direction.
The silver color commodity is finding stiff resistance at CNY 134,500, which is also the upper band of the channel. RSI (14-period) is trading at 59 levels which shows that the momentum of the prices is currently positive. Prices are also trading above 21-period and 50-period SMA, further confirming the positive trend.
Key Levels to Watch
Support Levels: On the lower side, the CNY 119,166 level is the immediate support level which also lies over the upward trendline support. However, a breakout of the CNY 119,166 level might further take prices down to their next support level of CNY 102,412.
Resistance Levels: On the upper side, CNY 138,712 is the immediate resistance level; however, if the prices sustain above CNY 138,712 there might fresh bull activity that could take the price up to CNY 147,788 in the medium-term.
Nickel Price Seasonality
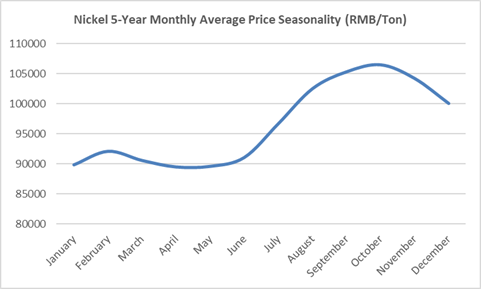
Chart Source: Kalkine Group, Data Source: EODHD/Others Eikon, Thomson Reuters
Nickel price seasonality is showing the trends in line with Copper price seasonality. After analysing the above 5-year monthly average seasonality chart, it is clear that the Nickel prices trade with weak bias starting with January month and last till June every year.Nickel draws in the demand after the June period which usually takes the prices upwards till October month.
Conclusion:
Prices of the majority of the base metals remained strong in the last 3 quarters due to spur buying amid technical breakouts. However, as discussed above, prices are now finding stiff resistance in the majority of the base metals. According to price seasonality charts, prices of base metals may trade with a weak tone in the first quarter every year. Considering the resistance levels and seasonality patterns, prices might come down in the first half of 2021 going by the technical setup.
