


Source: Avigator Fortuner, Shutterstock
Summary
- Recently, WTI Crude Oil plunged on demand concerns due to new pandemic curbs, however reversed sharply after Suez Canal was blocked.
- Germany and France expected to extend lockdown restrictions due to the jump in the COVID-19 cases.
- WTI crude oil has broken the major support zone on the daily chart.
- Currently, the WTI crude oil prices are facing major hurdle from the 21-Period SMA and Parabolic SAR indicators.
- Crude oil prices are facing the resistance of a downward sloping trend line on the monthly chart.
WTI Crude Oil futures tumbled to USD 57.76 per barrel on 23 March 2021 but retreated sharply on Wednesday after the grounded ship in the Suez Canal was feared to potentially obstruct 10 tankers carrying 13 million barrels of oil.
The crude oil prices have been extremely volatile in the past few days. The prices plunged around 6.16% on 23 March 2021 due to concerns of new pandemic curbs and slow vaccine rollouts in Europe which, is feared to result in the slow recovery of fuel demand. Besides as producers cut prices, indicating plenty of oil supply and creating further pressure on prices. Germany is expected to extend lockdown restrictions on shopping and travel in April as well to contain the third wave of COVID-19 infections, which led to cut their growth forecasts.

France has also entered a month-long lockdown on Saturday following a jump in cases in Paris and parts of northern France. All these factors played an important role in the crude oil prices and it tumbled from two-year highs. On 24 March 2021 crude oil price gained around 5.62 percent and closed at USD 61.18 level thanks to a stranded ship in the Suez Canal
Let us now look at how the charts are panning out for crude oil and gauge the mood of the market participants.
Technical Outlook on WTI crude prices
WTI crude oil price has shown a sharp rally from the low of USD 33.64 on November 2020 and made a two-year high of USD 67.98 level (on 8 March 2021) a gain of ~102 percent in this short span. Looking at the current chart structure, it is evident that the prices have been under pressure from the recent high and traded lower to hit a low of USD 57.25 (on 23 March 2021), a decline of ~16 percent in three weeks due to profit booking from higher levels.
WTI Crude Oil on a daily chart
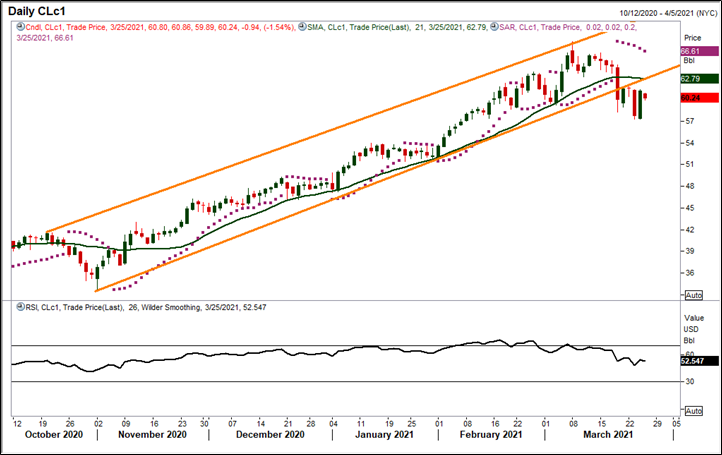
Source: EODHD/Others, Thomson Reuters; Analysis: Kalkine Group
On the daily chart, the WTI crude oil price has broken down from the lower support line of its ascending channel pattern at USD 61.20 level and made a new low of USD 57.25. If it manages to trade below the 21-period SMA of USD 62.79, then the prices might further be under pressure till the USD 52.80 level.
Besides, the price is trading below its 21-period SMA, acting as a crucial resistance zone at the lower end of the pattern. Crude oil price is well placed below its Parabolic SAR indicator and appears supportive for the downtrend. Furthermore, the momentum oscillator RSI (14-period) is trading at ~52 levels, indicating that the price is in a bearish momentum.
WTI Crude Oil monthly chart
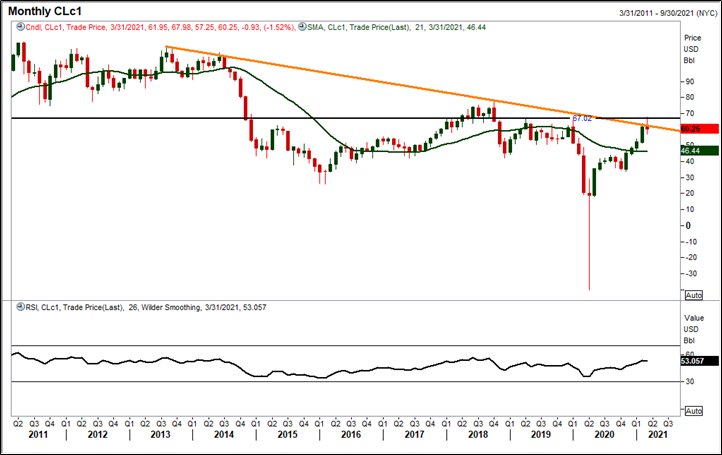
Source: EODHD/Others, Thomson Reuters; Analysis: Kalkine Group
After witnessing a robust rally, the WTI crude oil prices are facing strong resistance at its multi-year falling trend line at USD 63.10 level. Price has broken-out of its falling trend line (orange line in the above chart) at USD 63.10 level but failed to hold above the breakout level. It is to be noted that the WTI broke its four-months winning streaks due to selling pressure from higher levels.
Moreover, WTI crude oil prices have faced strong resistance of the horizontal trend line (black color line in the above chart) at USD 67.02 level. The momentum oscillator RSI (14-period) is trading at ~53 levels, indicating a neutral stance in the commodity. However, the price is trading above its 21-period SMA on the monthly chart, acting as a crucial support zone at the lower level and indicating that a rebound from here may push the price upside towards the USD 61.50 resistance level.
Based on the above demand concern and technical outlook, the WTI crude oil seems to be in the correction phase. Currently, prices are moving downward and facing resistance at higher levels. The chart patterns suggest that there might be some more correction expected in crude oil if the price remains below the support turned resistance zone in the coming weeks.
