
 AUS
AUS
 NZ
NZ
 UK
UK
 CA
CA
 USA
USA
 IND
IND








Source:Agnes Kantaruk, Shutterstock
Summary
- Global production of Cotton is expected to rise by ~4.70 percent in 2021/22.
- Global consumption of cotton has increased by ~14.48 percent in 2020/21.
- The prices are sustaining above an upward sloping trendline on the daily time frame chart and getting major support from 200-SMA.
- The commodity prices are trading above the 50.00% Fibonacci retracement level and delivered ~37.14 percent return in the last five months.
Global production of Cotton is expected to increase by 4.7 percent in 2021/22 thanks to the expected rise in production from Pakistan, Australia, Brazil, the United States, and West Africa. Production in the United States is up by 17 percent. Global consumption of cotton is also expected to grow by 4.1 percent as per the data published by USDA (United States Department of Agriculture/ Foreign Agricultural Service). China’s 2021/22 imports are estimated at 11.0 million bales, which is almost a 7-year high.
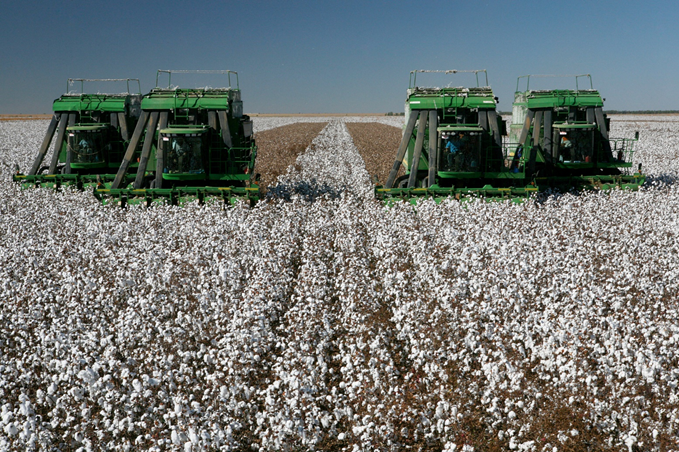
Image Source: © Casadphoto | Megapixl.com
Global Production and Consumption Outlook:
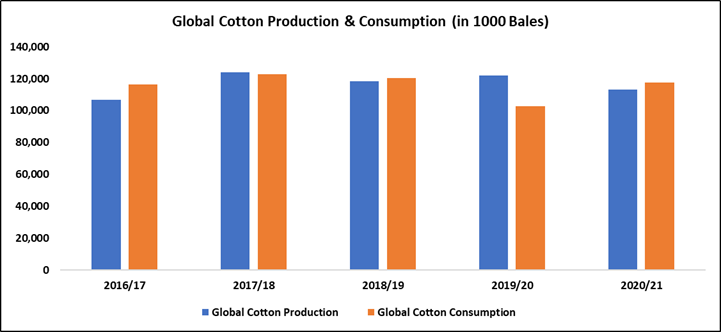
Global Cotton production for 2020/21 remained at 113,315 (in 1000 Bales), lower by ~7.21 percent as compared to 2019/20. While the global consumption for 2020/21 has increased by ~14.48 percent to 117,460 (in 1000 Bales), as per the USDA data.
Source: Foreign Agricultural Service/United States Department of Agriculture
Look at ICE Cotton Through Technical Charts
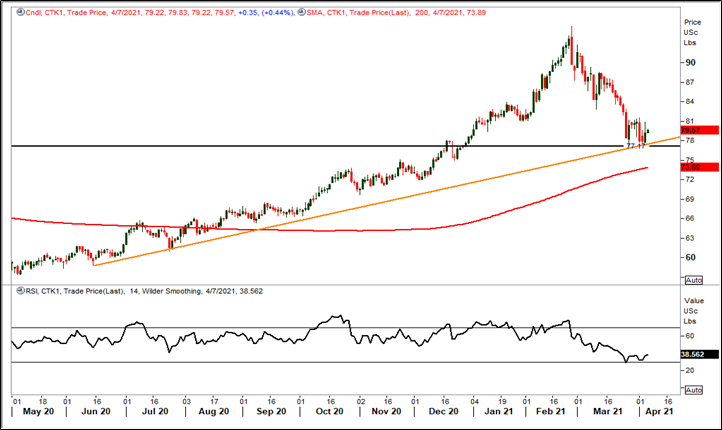
The ICE Cotton has shown an uninterrupted rally from the low of USc 69.71 made on November 2020 to a multi-year high of USc 95.60 in February 2021, a gain of ~37.14 percent in this short span. Currently, prices have corrected ~9.61 percent from the high of USc 95.60 and hit a low of USc 77.12 on 26 March 2021. The traders have booked profit post a good upswing in price. Cotton price has been trading in higher highs and higher bottoms formation for the last one year.
ICE Cotton on a daily chart
Source: EODHD/Others, Thomson Reuters; Analysis: Kalkine Group
The prices are trading above an upward sloping trendline support level of USc 78.60 and continuously taking support from the trendline. The price is also hovering near the horizontal trendline support zone USc 77.17 level (black color horizontal line in the above chart). Besides, the price is trading above its 200-period SMA, acting as a crucial support zone at the lower end of the trendline. The momentum oscillator RSI (14-period) is trading at ~38.56 levels near to oversold territory, a rebound from here may push the price upper towards the resistance zone.
ICE Cotton on a weekly chart
Source: EODHD/Others, Thomson Reuters; Analysis: Kalkine Group
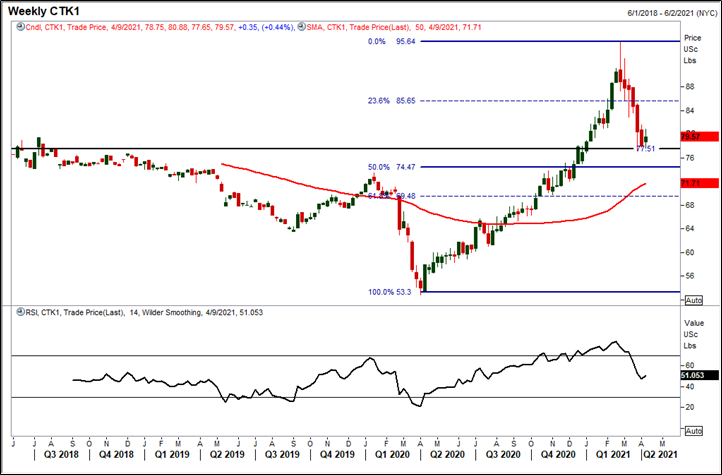
On the weekly time frame chart, cotton prices are trading above 50.00% Fibonacci retracement support level at USc 74.47 of the previous rally (from USc 53.3 to USc 95.60). Currently, the price is hovering near the horizontal trendline support (black color horizontal line in the above chart) and sustaining above the major support level of USc 77.51.
Also, the prices are trading above the 50-period SMA, which acts as a crucial support zone for the commodity. The momentum oscillator RSI (14-period) is trading at ~51 levels, indicating a neutral to a positive trend for the commodity. A bullish harami candlestick pattern (bullish reversal) is spotted on the weekly chart, indicating the possibility of an upside reversal in the prices.
The chart pattern suggests that ICE Cotton is in a correction phase and currently, prices are consolidating on the lower levels. Based on the current fundamental and technical outlook, there might be more action expected in commodity if the price remains above the support levels or breaks the crucial resistance levels in the coming weeks.
