
 AUS
AUS
 NZ
NZ
 UK
UK
 CA
CA
 USA
USA
 IND
IND


.jpg)





Source: Parilov, Shutterstock
Summary
- Lead Futures (SHFE: SPBc1) prices are trading above an upward sloping trend line for the past 1 year, indicating an uptrend for the commodity.
- Lead Futures prices are trading above the 21-period SMA, 50-period SMA and Parabolic SAR, suggesting the trend to be on the upside movement.
- Zinc Futures (SHFE: SZNc1) prices witnessed a sharp upside of 57 percent from the low made in March 2020 to the high of CNY 22305 made in December 2020.
- Zinc Futures prices broke an upward sloping trend line in January 2021 and since then trading below the breakout level.
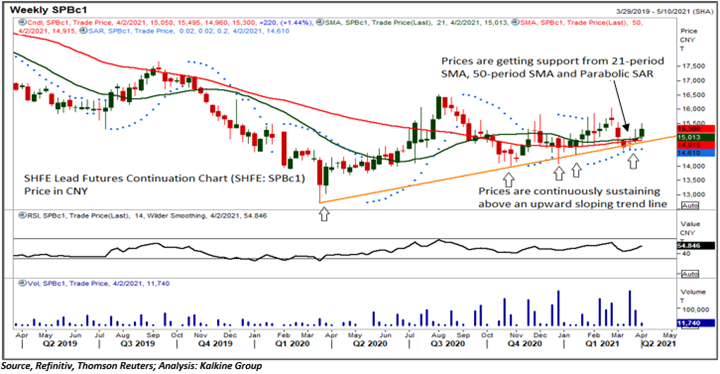
Lead Futures (SHFE: SPBc1) prices are trading above an upward sloping trend line (orange color line in the below chart) for the past 1 year, indicating an uptrend for the commodity. Prices started to move upside from the latter half of March 2020 and witnessed ~30 percent gain till August 2020. However, post that the prices retraced more than 15 percent from the high of CNY 16,520 made in August 2020 till October 2020 and then consolidated in a range.
Recently prices corrected ~10 percent from the high of CNY 16,050 made on February 23, 2021 and reversed upside after taking support of the upward trendline. Despite all the volatility, prices managed to sustain above the upward trendline, acting as the major support for the commodity on the lower level.
How is Lead looking on the charts?
On the weekly chart, the leading indicator RSI (14-period) is trading at ~55 levels, indicating a sideways to positive stance for the commodity. RSI (14-period) is trading in a range of 40-63 for the past 8 months and recently recovered from the lower levels. The prices are trading above the 21-period SMA (green color line in the above chart) and 50-period SMA (red color line in the above chart) and appears supportive for an upside movement. Prices are also trading above the trend-following indicator-Parabolic SAR, further indicating a positive stand for the commodity.
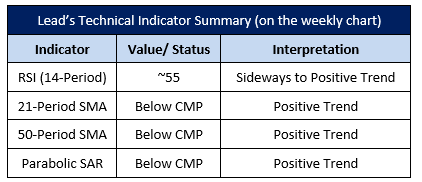
Currently, the prices are getting support from several technical indicators coupled with the upward sloping trend line. On the downside, CNY 14,580 is acting as the major support level where 21-period SMA, 50-period SMA, Parabolic SAR, and an upward sloping trend line support level rest and a breakout of the CNY 14,580 might attract the bears.
A lens through Zinc on charts
Zinc Futures (SHFE: SZNc1) prices witnessed sharp upside movement from the low of CNY 14,220 made in March 2020 to the high of CNY 22,305 made in December 2020 and witnessed a decent gain of ~57 percent. Prices broke an upward sloping trend line (orange color line in the below chart) in January 2021 after forming a moderate negative divergence with the RSI (14-period). Since then, it is trading below the breakout level. For the past 2 months, prices are consolidating and indicating a lack of market participation at the current levels.
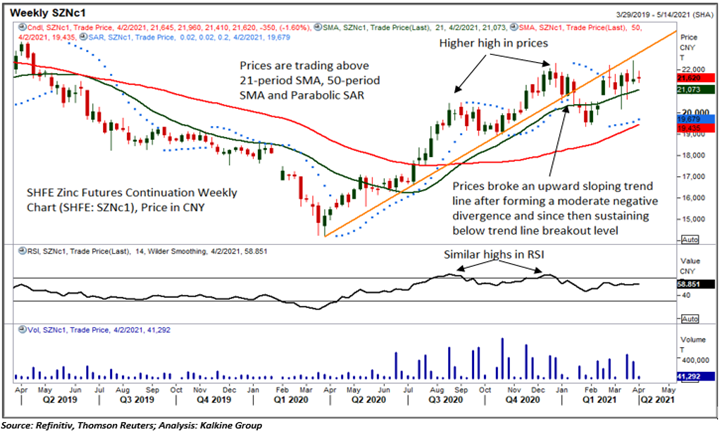
On the weekly chart, the trend following indicators 21-period SMA (green color line in the above chart) and 50-period SMA (red color line in the above chart) are below CMP and indicating an upside movement for the commodity. Prices are also trading above another trend-following indicator-Parabolic SAR, further providing strength to the prices. The momentum indicator RSI (14-period) is trading at ~59 levels, indicating a positive stance for the commodity.
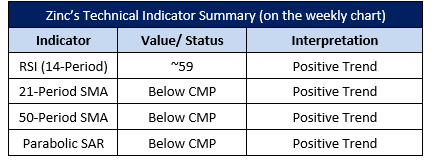
Currently, the prices are facing resistance from the support turned resistance upward sloping trend line, however, getting support from the 21-period SMA, 50-period SMA, and Parabolic SAR. The prices are trading at crucial levels and either side's move will decide the short-term trend for the commodity.
