
 AUS
AUS
 NZ
NZ
 UK
UK
 CA
CA
 USA
USA
 IND
IND







Summary
- An extensive consolidation phase in gold ranging between USD 1,846- USD 1,967 per troy ounce is not giving positive signs in shorter duration charts.
- Gold prices reacted negatively taking cues from the Joe Biden presidential election win.
- Stimulus Package hopes blurred with Trump losing in the presidential election
- Gold currently follows its 5-Year Monthly Average Seasonality price pattern, which indicates that prices start declining from September to December month period every year.
Gold spot's multi-contributor prices are continuously trading in the consolidating range between USD 1,846-USD 1,967 per troy ounce. However, Gold prices gave two consecutive closes below the 21-period moving average after the post-March COVID-19 period, signaling gold bulls are tired and the coming weeks’ trade could be crucial.
Gold Spot Multi-Contributor (XAU/USD) on Weekly Technical Chart
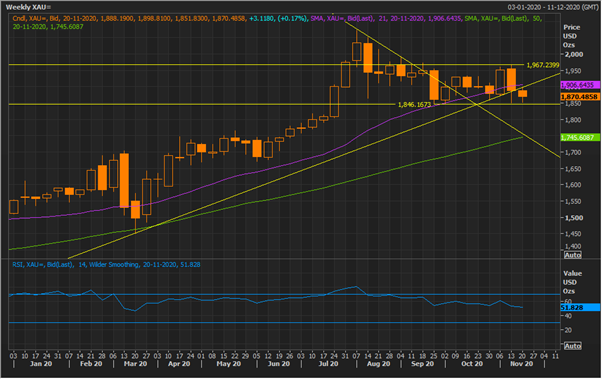
XAU Weekly Chart (Source: EODHD/Others Eikon, Thomson Reuters)
Gold prices are currently facing stiff resistance around 21-period mean average levels. Relative Strength Index RSI (14) indicator is also coming down slightly towards 50 levels down from 60, suggesting that bull participants are losing strength over bears in the market. Immediate resistance for gold prices is at around USD 1,910, which also lies at the 21-period moving average and upward sloping resistance line.
If the prices find heavy selling orders at USD 1,910, the selling pressure could take the prices down to the next support level at USD 1,846. However, a breach of the USD 1,846 level might further take prices down to USD 1,810 and USD 1,750, going by the chart pattern suggestions. On the upper side, the sustainability of prices above USD 1,910 might further advance the price to USD 1,967 in line with its current consolidation range.
Also Read: Volatility In Gold And Crude Surges On The Heels Of US Presidential Elections 2020
Bearish Flag Pattern Witnessed on 4-Hour Gold Spot Multi-Contributor (XAU/USD) Chart
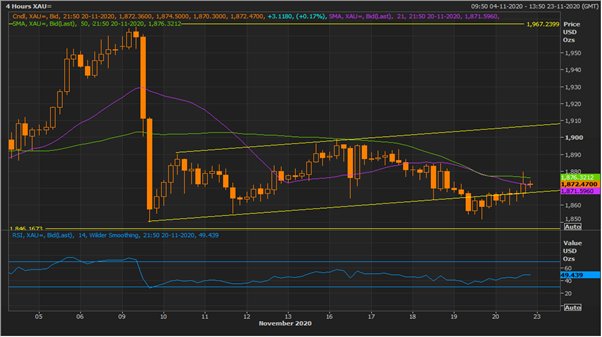
XAU 4-Hour Chart (Source: EODHD/Others Eikon, Thomson Reuters)
Gold prices are currently trading in a bearish flag pattern whilst hovering in a short upward channel ranging between USD 1,867-USD 1,910 on a short period 4-hour price chart. Prices recently broke below the lower channel trajectory; however, bulls managed to sustain the prices back in the above mentioned upward channel. However, taking cues from the longer weekly chart time frame, it is could be deciphered that the current price range could be a bull trap for market participants as prices might find stiff resistance at USD 1,910 at 21-period moving averages.
Good Read: Is the Gold Price Ready to Move Out of Shadows?
What is Bearish Flag Pattern?
The bearish flag pattern is one of the most popular price action patterns which is also a continuation pattern which academically suggests that after a big market fall, prices tend to continue downwards in the coming period after a short consolidation phase.
To identify a bearish flag on charts it is mandatory to look at the support and resistance lines forming the flag which needs to be parallel to each other and should be upward sloping. The strong downside line starting from A point and ends with B point are the flag poles.
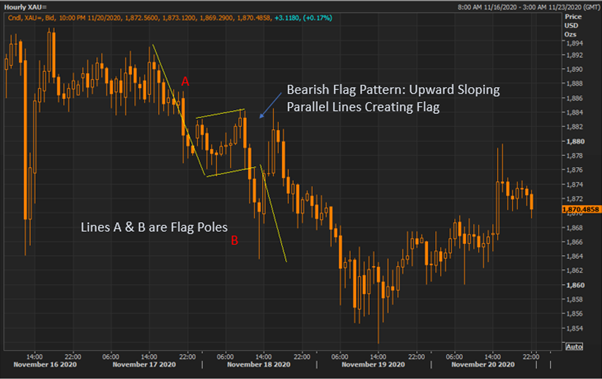
(Chart Source: EODHD/Others Eikon, Thomson Reuters)
Fundamental Factors Influencing Gold Prices
The most important factor which could impact the gold prices is when the COVID-19 vaccine becomes available, which allows the major global economies to go back to a normal. With the availability of the vaccine, some market participants are of the view that gold prices could come under pressure. It is noticeable that gold prices have mostly been reactive in the post-March COVID-19 period and surged up sharply till August 2020, making all-time highs of around USD 2,075.
Must Read: Positive Vaccine news punctures Gold bubble, ASX Gold Stocks Under Pressure
In addition to it, the U.S. Fed stimulus package hopes faded with Joe Biden’s U.S. 2020 presidential election win, which currently seems a deterrent for the gold prices.
There are arguments floated in the recent past which suggest stimulus packages being a bearish factor for gold prices and bullish factor for the economy, as it will end up helping businesses and stabilizing the economy that is suffering from COVID-19 impacts.
What does 5-Year Monthly Average Gold Price Seasonality say?

Chart Source: Kalkine Group, Data Source: EODHD/Others Eikon, Thomson Reuters
Gold Spot's 5-year monthly price seasonality clearly shows that the prices started declining from September onwards till December. It is eminent from the above chart that current gold spot prices are following its 5-year monthly price seasonality pattern.
