


Summary
- Elixir Energy Limited (ASX:EXR) rallies over 13 per cent after witnessing a gap-up opening during the trading session.
- The stock gained momentum post the Company disclosed an operational update for Nomgon IX CBM PSC.
- Nomgon 5S re-drill appraisal strat-hole reaches full depth.
- Where are the charts reading?
Elixir Energy Limited (ASX:EXR) opens gap-up on the exchange on 5 November 2020 followed by a ~ 13.04 per cent surge (12:18 PM AEDT) against its previous close on ASX.
The Company disclosed price-sensitive information on 5 November 2020 that now seems to be piquing the interest of the market participants.
EXR Provides Operational Update
EXR notified the shareholders about the progress made by the explorer at its wholly-owned Nomgon IX CBM PSC.
- The Company suggested that the re-drill appraisal strat-hole at Nomgon 5S reached a total depth of 450 metres for the current well with a total net coal intersection of 47m.
- Furthermore, EXR mentioned that the drilling at the Hutul 1S exploration well is ahead of schedule and should reach total depth by next week.
EXR further stated that it plans to drill two more exploration strat-holes by the end of the year and is currently working with its drilling contractors to finalise local permits for the same.
However, the Company is yet to decide the timing of the spud of the next well, but it is planned for next week.
- MD Neil Young mentioned that strong net coal from Nomgon 5 represents the fifth consecutive successful wells in the Nomgon sub-basin.
- Adding to the comments, Mr Young mentioned that EXR now plans to analyse and integrate the data from Nomgon wells, leading to updated prospective resource numbers followed by maiden contingent resource booking.
EXR on Charts
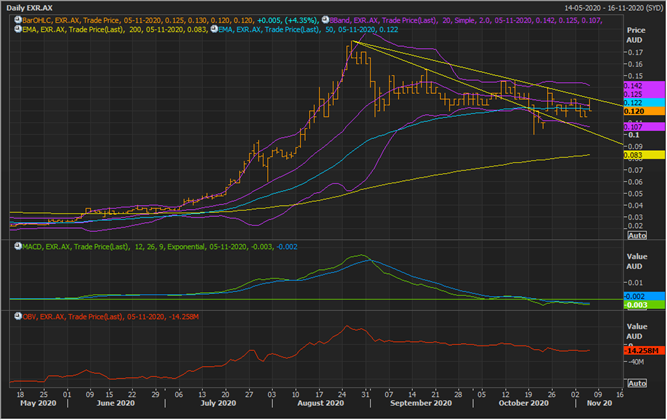
EXR Daily Chart (Source: EODHD/Others Eikon Thomson Reuters)
On following the daily chart, it could be seen that the primary trend is an uptrend with the stock trading above the 200-day exponential moving average. However, at present, EXR is under a correction and is currently hovering around the 50-day exponential moving average.
- Currently, the primary resistance for the stock is at the upper downward sloping trendline, which the stock tested during the trading session on 5 November 2020.
- Also, the 20-day simple Bollinger Band® is expanding after a slight squeeze, suggesting that the volatility is picking up on correction.
- The expansion in the Bollinger Band® coupled with the current support around the 50-day exponential moving average is reflecting a slight bullish interest on corrections.
- However, the stock is currently into a resistance zone.
- A break above the short-term resistance line followed by a volatility breakout, i.e., a price move above the +2 Standard Deviation of the 20-day simple Bollinger Band® could fan the bullish interest.
- On the flip side, a break below the 2nd line (from up) of the resistance zone, which should now serve as the support line could seed bearish sentiments.
- On the downside, the -2 Standard Deviation of the Bollinger Band® is overlapping with the 2nd line of the resistance zone; thus, the 2nd line of the resistance zone (or a support line for now) is decisive.
- The 12,24,9 MACD is currently showing a negative cross with the signal line moving below the base line.
- The 14-day On Balance Volume (OBV) is moving in tandem with the price action.
