


Summary
- Shares of cruise companies Carnival Corporations (NYSE:CCL) and Royal Caribbean Group (NYSE:RCL) rallied on Monday, November 9.
- The cruise stocks began trending following the announcement from pharmaceutical companies Pfizer and BioNTech that their COVID-19 vaccine candidate showed 90 per cent effectiveness in the latest trial.
- During the intraday trading on Monday, shares of Carnival Corporation shot up by about 39 per cent.
- Royal Caribbean’s stock price skyrocketed nearly 29 per cent on Monday, closing at US$ 75.43.
Much like the aviation sector, the COVID-19 pandemic brought many troubles for the ship cruise industry too. In the first week of November, things seemed pretty bleak for the sector with major cruise companies such as Carnival Corporations (NYSE: CCL, CCL: US) and Royal Caribbean Group (NYSE: RCL, RCL: US) announced that their operations would remain suspended through December 2020.
However, shares of Royal Caribbean and Carnival Corporation shot up on Monday following the news of pharmaceutical companies Pfizer (NYSE: PFE, PFE:US) and BioNTech (NASDAQ:BNTX, BNTX:US) coming up with 90 per cent effectiveness in their COVID-19 vaccine candidate.
Let’s take a closer look at these two companies to understand their stock performances better.
Carnival Corporation (NYSE: CCL, CCL:US)
Current Stock Price: US$19.25
After a smooth cruise at the beginning of the year, Carnival Corporation’s stock price plunged sharply in March when the markets bottomed out during the onset of the pandemic. While it has recovered since Carnival Corporation stock is still far below its pre-pandemic levels in February. It is currently down about 62 per cent this year.
The scrips have rebounded over 35 per cent in the last six months and more than 40 per cent in November so far.
During the intraday trading on Monday, November 9, shares of Carnival Corporation shot up by about 39 per cent, closing at US$ 19.25.
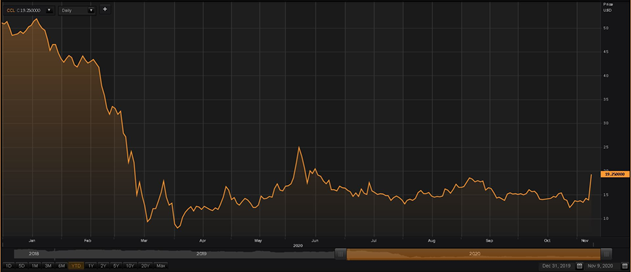
YTD chart of Carnival Corporation’s stock movement (Source: EODHD/Others/Thompson Reuters)
Carnival Corporation secured an average share movement volume of 50.6 million in the last 10 days. Its currently has a 52-week high of 51.94.
CARNIVAL CORPORATION Q3 2020 FINANCIAL RESULTS
Beaten by the pandemic, the Miami-based cruise company recorded a net loss of US$ 2.9 billion for the third quarter of 2020, as against a net income of US$ 1.7 billion in Q3 2020. The loss incurred in the latest quarter included US$ 0.9 billion in non-cash impairment charges.
Carnival Corporation’s revenue in the third quarter (ending August 31, 2020) dropped to US$ 31 million, from US$ 6.5 billion in Q3 2019. The company said that its cash burn rate in Q3 2020 and estimated rate for Q4 2020 are in line with its expectation.
Its cash and cash equivalents stood at US$ 8.2 billion at the end of the third quarter of 2020. Carnival Corporation also announced in the third-quarter report that its Italian brand Costa resumed guest cruise operations in September 2020, while its German sourced brand AIDA is set to resume operations in fall 2020.
Royal Caribbean Group (NYSE: RCL, RCL:US)
Current Stock Price: US$ 75.43
Like Carnival Corporation, shares of Miami-based Royal Caribbean Group also took a steep tumble amid the March market crash. Since then, the stocks have recovered about 56 per cent in the following eight months.
Royal Caribbean scrips have registered a growth of nearly 89 per cent in the last six months and about 60 per cent in the last three months. However, its shares are downing almost 44 per cent year-to-date (YTD).
Royal Caribbean’s stock price skyrocketed nearly 29 per cent on Monday, closing at US$ 75.43. It has accumulated a 10-day average share trading volume of 9.1 million.
ROYAL CARIBBEAN Q3 2020 FINANCIAL RESULTS
Royal Caribbean Group recorded a US GAAP net loss of US$ 1.3 billion in the third quarter ending 30 September 2020, compared to a US GAAP net income of US$ 883.2 million in Q3 2019. The company listed the loss incurred in the latest quarter as a result of the impact of the pandemic.
The company estimates its cash burn will be between US$ 250 million and US$ 290 million each month during the lockdown period.
Royal Caribbean Group had a liquidity of about US$ 3.7 billion at the end of September 2020, which included US$ 3 billion in cash and cash equivalents. This amount was down from a liquidity of US$ 4.1 billion as of 30 June 2020.
It also reported a total cash expenditure of about US$ 1.1 billion in Q3 2020, which the company said was primarily driven by ship operating expenses.
In its third quarter 2020 report, the company stated that it resumed some cruise operations outside the US in July and September for a limited period of time.
Royal Caribbean’s market cap stands at US$ 16.92 billion. Its price-to-book (P/B) ration is 2.032, its price-to-cash flow (P/CF) ratio is 4.2 and its debt-to-equity (D/E) ratio is 2.35, as per the data available on the TMX Group.
