


Summary
Telecom stocks have stayed resilient during the pandemic times. Industries adapting to the new normal have resumed operations in full swing, implementing work-from-home models. This presents the need for faster internet speed, latency minimisation, and data at affordable costs. Fifth generation (5G) undoubtedly is the need of the hour to access seamless connectivity at lightning speeds. Telecom giants such as BCE Inc (TSX:BCE), Cogeco Communications Inc. (TSX:CCA) and TELUS Corporation (TSX:T) have launched 5G networks in select Canadian locations amid the Covid-19 outbreak.
However, 5G roll-out by regional network carriers Videotro, Freedom Mobile and SaskTel suffered because of the pandemic and now will only be seen in 2021.
Rogers launched its first 5G New Radio (NR) network in downtown Vancouver, Ottawa, Toronto and Montreal with its vendor Ericsson in the beginning of 2020. BCE chose to delay 5G launch with its vendor Nokia but quietly began selling 5G-capable devices such as Galaxy S20+ 5G, Samsung Galaxy S20 5G and Galaxy S20 Ultra 5G.
The S&P/TSX Capped Telecommunication Services Index is currently down almost 11 per cent year-to-date.
BCE Inc. (TSX:BCE)
Current Stock Price: C$56.21
The company is one of the three big national wireless carriers in Canada offering wireless home internet, LTE advanced, broadband, Fibre internet, television, cloud and data hosting, and landline phone services. The company expanded its home wireless internet reach to rural Canadian homes with enhanced speeds.
BCE STOCK PERFORMANCE
BCE stocks are down 6.56 per cent year-to-date. The company has a current market capitalization of C$50.83 billion and earnings per share (EPS) of C$2.71. As per data on the TMX Group, the profit-to-equity (P/E) ratio of the company is 20.70, the profit-to-book (P/B) ratio of 3.02 and profit-to-cash flow (P/CF) ratio of 6.10. The company offers positive return on equity (RoE) and return on assets (RoA) at 14.75 per cent and four per cent, respectively. It holds a dividend yield of 5.92 per cent.
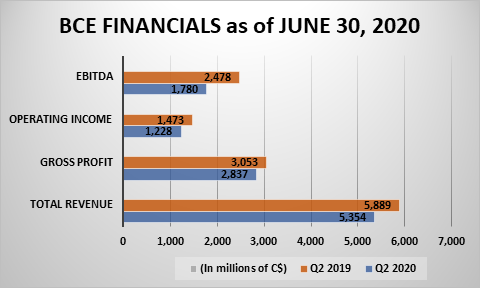
BCE FINANCIAL HIGHLIGHTS
The company revenues declined from C$5.88 billion in June 2019 to C$5.35 billion in the second quarter ended June 30, 2020. The gross profit saw a decline as well from C$3.05 billion in Q2 2019 to C$2.83 billion in Q2 2020. However, cash flow from operations saw an increase to C$2.56 billion in Q2 2020 from C$2.09 billion in the same quarter last year. The EBITDA saw a decline from C$2.47 billion in Q2 2019 to C$1.78 billion in Q2 2020.
It distributed quarterly dividend pay-out of C$0.83.
The company will announce third quarter financial results on November 5, 2020.
Cogeco Communications Inc. (TSX:CCA)
Current Stock Price: C$103.50
Cogeco Communications Inc is a North American communication company providing residential and business customers Internet, video, broadband fibre networks and telephone services in Canada. The company invested C$3.2 million to expand its broadband network in Quebec and C$10 million to boost digital infrastructure and broadband services in Ontario through its subsidiary Cogeco Connexion in collaboration with the Government of Canada.
CCA STOCK PERFORMANCE
The company offers C$7.66 earnings-per-share (EPS) and profit-to-equity (P/E) ratio of 13.60. Quarterly dividend payout is C$0.58 and holds a yield 2.20 per cent. The current market capitalization is C$3.33 billion. As per data on TMX, the profit-to-equity (P/E) ratio is 13.50, profit-to-book (P/B) ratio is 2.19 and profit-to-cash flow (P/CF) ratio is 5.30. The company offers positive RoE and RoA at 16.69 per cent and 5.29 per cent, respectively. Year-to-date performance of the scrips show decline of 8.56 per cent.
CCA FINANCIAL HIGHLIGHTS
The company reported total revenue increase of C$606 million in third quarter results 2020, as compared to C$587 million in the same period last year. The adjusted EBITDA for Q3 2020 shows an increase as well to C$295 million as compared to C$285 million in Q3 2019.
The cash flow from operating activities increased to C$282 million in Q3 2020, as compared to C$266 million in Q3 2019. The capital expenditures in Q3 2020 shows an increase to C$124 million, as compared to C$96 million in Q3 2019. The company’s free cash flow reduced from C$137 million in Q3 2019 to C$116 million in Q3 2020.
Profit from continuing operations declined from C$ 100 million in Q3 2019 to C$97 million in Q3 2020.
TELUS Corporation (TSX:T)
Current Stock Price: C$23.98
TELUS Corporation is among the top three wireless service providers in Canada, with 9-million and more mobile phone subscriber base. It is also an ILEC (incumbent local exchange carrier) serving western Canadian provinces of Alberta and British Columbia with broadband Internet, telephone, and television services. The company presence in eastern Quebec as well.
TELUS STOCK PERFORMANCE
Telus’ current market capitalization stands at C$30.80 billion. It offers earnings-per-share (EPS) of C$1.18 and profit-to-equity (P/E) ratio of 20.40. Quarterly dividend pay-out declared by the company is of C$0.29. The current dividend yield is 4.85 per cent.
Data on TMX shows, the profit-to-book (P/B) ratio of 2.559 and profit-to-cash flow (P/CF) of 6.40. Positive return on equity (RoE) and return on Assets (RoA) is offered at 12.64 per cent and 3.75 per cent, respectively.
TELUS FINANCIAL HIGHLIGHTS
Total revenue of the company for the second quarter ended June 30, 2020 stood at C$3.65 billion, as compared to C$3.58 billion in the same quarter last year. Gross profit increased to C$2.19 billion from C$2.12 billion in Q2 2019. The operating expense increased to C$1.63 billion, as compared to C$1.38 billion in Q2 2019.
Operating income, however, decreased in Q2 2020 of C$565 million, as compared to C$736 million in Q2 2019. Operating cash flow increased from C$1.16 billion in Q2 2019 to C$1.46 billion in Q2 2020.
