


Australian Stock Exchange (ASX) has classified the indices in six broad types based on capitalisation, fixed income, residential property, sector, strategy, and volatility. Indices based on capitalisation includes S&P/ASX 20 Index, S&P/ASX 50 Index, S&P/ASX 100 Index, S&P/ASX 200 Index, S&P/ASX 300 Index, S&P/ASX MidCap 50 Index, etc.
Of these, the S&P/ASX 200 Index (XJO) is a prominent investment benchmark and broadly used as an underlying institutional investable yardstick for the assessment of returns by stocks and other purposes in Australia. S&P/ASX 200 Index includes the 100 stocks under the S&P/ASX 100 Index, and besides, comprises 100 more stocks. The index was launched on April 03, 2000.
How companies under XJO are selected: The companies falling in the index are recognised and selected by S&P (Standard & Poorâs) and ASX. ETFs (Exchange Traded Funds) and LICs (Listed Investment Companies) are not included in this index. The eligibility criteria to include the stock in the index is the minimum required volume and investment benchmarks.
S&P conducts rebalancing of the index on a quarterly basis, say March, June, September and December. However, in case of any major event or merger and acquisition, etc., a mid-quarter rebalancing can also occur with the requirement of earlier notice of minimum two business days to the market.
Eligibility Criteria: For the inclusion of stock to S&P 200 Index, three parameters are generally considered:
(1) Market Capitalisation â float adjusted market capitalisation of the stock is considered, which is a function of existing index shares, latest available stock price and IWF (Investable weight factor).
(2) Liquidity - Trading volume and counts of the transaction has to be minimum 0.025% of the total eligible securities' trading volume. However, for a company to dominate the trading, there is a cap of 15% for value, volume and transactions.
(3) Listing on ASX - The stocks listed on ASX will be considered for such inclusion.
Index Characteristics: The index is comprised of 200 stocks. As of 28th June 2019, mean of the total market capitalisation stood at $9397.31 million, with a largest market capitalisation of $14,5679.8 million and smallest market capitalisation of $411.2 million. Top 10 constituents accounted for ~44.7% of the total market capitalisation, with the largest constituent weighing ~8.3%.
Top Ten Constituents by Index Weight: Out of these top 10, five stocks are related to the financials. These 10 stocks are â (1) Commonwealth Bank of Australia (2) BHP Group Ltd (3) Westpac Banking Corp (4) CSL Ltd (5) Australia and New Zealand Banking Group Limited (6) National Australia Bank Ltd (7) Telstra Corp Ltd (8) Woolworths Group Ltd (9) Wesfarmers Ltd (10) Macquarie Group Ltd.
Fundamentals: The S&P/ASX 200 Index is trading at trailing price to earnings multiple of 17.45x, with a projected price to earnings of 16.74x as of June 2019. At current level (as of 28 June 2019), the index is available at 1.83x of its book, 2.18x of its sales, and 13.7x. of its cash flow.
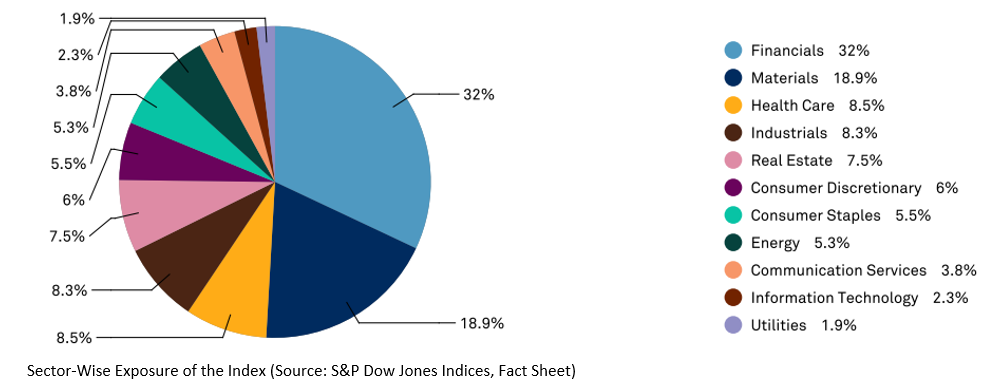
Sector-wise Classification of S&P/ASX 200 Index: All S&P/ASX Indices use the Global Industry Classification Standard (GICS) to categorise constituents according to their principal business activity. As of June 2019, Financials and Materials accounted for the highest chunk of the index with the share of 32% and 18.9%, respectively. This has been followed by Health Care, Industrials and Real Estate accounting for 8.5%, 8.3% and 7.5%, respectively. Consumer Discretionary, Consumer Staples and Energy accounted for 6%, 5.5% and 5.3%, respectively. Sectors witnessing the comparatively lower exposure were Communication Services, Information Technology and Utilities, which stood at 3.8%, 2.3% and 1.9%, respectively.
Country-wise Break Down of S&P/ASX 200 Index: The index is comprised of 187 companies domiciled in Australia, with a total market capitalisation of $1,819,374.12 million and total index weight of 96.7%. New Zealand accounted for seven companies with a total market capitalisation of $25,186.51 million with index weight of 1.6%, followed by the United States, representing four companies with a market capitalisation of $28,614.45 million with index weight of 1.3%. France and the United Kingdom held one company each with a market capitalisation of $3,328.32 million and $2,958 million with index weight of 0.2% each, respectively (as of 28 June 2019).
Performance of S&P/ASX 200 Index: Looking at the performance, the Index has generated an annualized return of 11.55% for one-year and 12.88% for three years. In the last five and ten years, the Index has given returns of 8.85% and 10.02%, respectively.
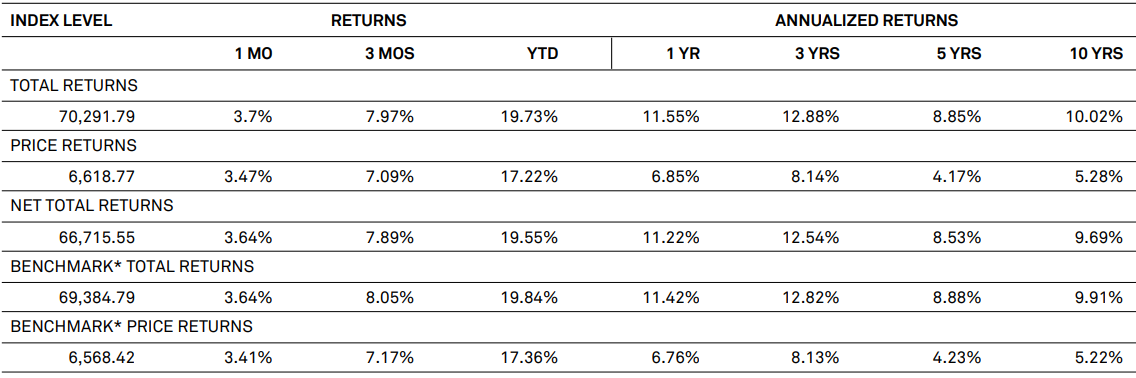
(Source: S&P Dow Jones Indices Fact Sheet as of 28 June 2019)
Basic Snapshot of the Top 10 Companies: Letâs briefly discuss the top 10 companies with their business profile, key valuation parameters and current trading level.
(1) Commonwealth Bank of Australia (ASX: CBA), one of the leading banks in Australia, is trading at a price to earnings multiple of 15.83x, at the current share price of $81.520 on ASX. The market capitalisation stands at $143.81 billion, with an annual dividend yield of 5.31%.
(2) BHP Group Ltd (ASX:BHP), among the top producer of major commodities, iron ore, metallurgical coal and copper, is a large cap company with a market capitalisation of $121.46 billion and an annual dividend yield of 4.04%. The stock has generated a return of 27.30% in the last one year. At the current market price of $40.970, the stock is trading at a price to earnings multiple of 28.21x.
(3) Westpac Banking Corp (ASX: WBC), a renowned name among the largest banks, offers an annual dividend yield of 6.72%, at the current stock price of $28.020. The stock is available at a price to earnings multiple of 13.580x and has gained ~14.30% on a YTD basis.
(4) CSL Ltd (ASX: CSL) is engaged in the research, development, manufacturing, marketing and distribution of biopharmaceutical and allied products with a market capitalisation of $100.48 billion. The stock is trading towards the higher end of the 52-week range at $221.00, with a price to earnings multiple of 38.760x.
(5) Australia and New Zealand Banking Group Limited (ASX: ANZ), a powerful banking entity in Australia, is advocating for the annual dividend yield of 5.86% at the current share price of $27.270. The stock is available at a price to earnings multiple of 12.470x. The stock has gained ~15% on a YTD basis.
(6) National Australia Bank Ltd (ASX: NAB) is a big banking name with a higher dividend yield of 6.71% and current market capitalisation of $78.19 Billion. The stock of NAB is trading at 13.220x of its earnings, at the current market share price of $27.170. The stock has gained ~15% on a YTD basis.
(7) Telstra Corp Ltd (ASX: TLS), a telecommunication and information services provider, has a market capitalisation of $46.38 billion. The stock offers an annual dividend yield of 3.21% at the current market price of $3.890 and is trading at 14.940x of its earnings. The stock has witnessed a significant gain of ~34% in the last six months.
(8) Woolworths Group Ltd (ASX:WOW) is engaged in foods and beverage, owned stores and hotels, primarily operating in Australia and New Zealand. At the current market price of $34.230, the stock is available at a price to earnings of 25.960x, with an annual dividend yield of 2.76%. The stock is trending towards its higher end of 52-week high and has gained ~18% on a YTD basis.
(9) Wesfarmers Ltd (ASX: WES), with its consolidated activities, is engaged with a diversified set of industries such as coal and mining, supermarkets, fuel and liquor, chemicals and fertilizers, etc. The stock, at a current market price of $37.760, is trading at a price to earnings multiple of 7.690x, with an annual dividend yield of 5.85%. The stock has gained ~21% in the last six months.
(10) Macquarie Group Ltd (ASX: MQG) a diversified financial group, offers an annual dividend yield of 4.53%, with a market capitalisation of $43.24 billion, at the current share price of $127.510. The stock is trading at a price to earnings multiple of 14.380x and has gained ~19% on YTD.
Disclaimer
This website is a service of Kalkine Media Pty. Ltd. A.C.N. 629 651 672. The website has been prepared for informational purposes only and is not intended to be used as a complete source of information on any particular company. Kalkine Media does not in any way endorse or recommend individuals, products or services that may be discussed on this site. Our publications are NOT a solicitation or recommendation to buy, sell or hold. We are neither licensed nor qualified to provide investment advice.
