
 AUS
AUS
 NZ
NZ
 UK
UK
 CA
CA
 USA
USA
 IND
IND







Summary
- The benchmark index, i.e., S&P/ASX 200 Index has demonstrated a strong June 2020 quarter with a rally of nearly 40 per cent.
- However, post rallying or recovering the market seems to be reaching a phase of consolidation with many stocks circulating or oscillating around crucial support or resistance level.
- The surge followed by a phase of consolidation is par for the course. In this consolidation mode some stocks are showing some interesting signals on Charts.
The S&P/ASX 200 Index has demonstrated a strong June 2020 quarter with the index surging by nearly 40 per cent from the level of 4,402.50 (intraday low on 23 March 2020) to the present high of 6,160.60 (as on 21 July 2020).
In this phase some listed stocks have developed some interesting signals on Charts. Many ASX-listed stocks have either rallied or recovered since the onset of the June 2020 quarter till now.
However, post rallying or recovering the market seems to be reaching a phase of consolidation with many stocks circulating or oscillating around crucial support or resistance level while the S&P/ASX 200 Index is hovering in the range of 6,160 to 5,800.
ASX-listed Stocks Showing Interesting Development on Charts
City Chic Collective Limited (ASX:CCX)
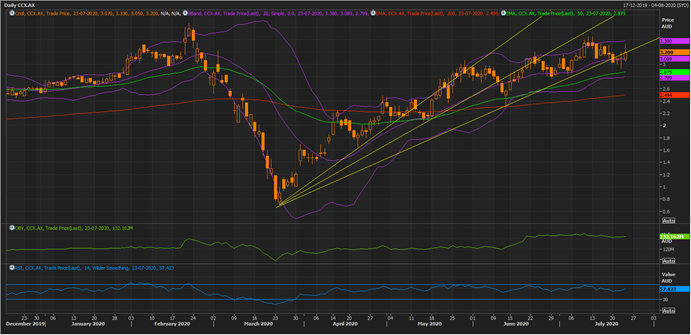
CCX Daily Chart (Source: EODHD/Others Eikon Thomson Reuters)
On following the daily chart, it could be seen that post moving in an uptrend for quite some time; the stock is finally showing falling volatility, which could be inferred from the squeezing 20-day Simple Bollinger band.
- On closing following the recent rise, it could be seen that the stock is currently testing the support zone; however, has breached the support trendline during the trading session on 24 July 2020.
- The stock is presently trading above the pair of the 200-day and 50-day exponential moving average, suggesting that the primary short-term trend is an uptrend.
- Below the trendline, the major support for the stock is at the -2 Standard Deviation (or SD), which is overlapping with the 50-day EMA.
- The On Balance Volume is becoming flat, reflecting upon the tiredness of bulls to continue the rally; however, the 14-day RSI is still hovering slightly above the mean value and below the overbought zone.
- The recent high of $3.450 along with the +2 SD of the Bollinger band should act as resistance for the price, while the major support is at the -2 SD.
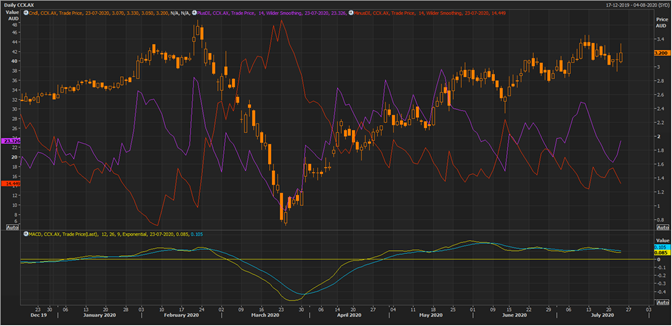
CCX Daily Chart (Source: EODHD/Others Eikon Thomson Reuters)
On applying the directional signals on the daily chart, it could be seen that the gap between the plus DI and minus DI is now narrowing down; however, both signals line are not giving any negative crossover, as the stock is still hovering above the support of -2 SD.
- Though the 12,24, 9 indicator is showing a negative signal with the signal line (yellow) slipping below the MACD line as MACD signals are generally more sensitive to the latest price action.
Prospa Group Limited (ASX:PGL)
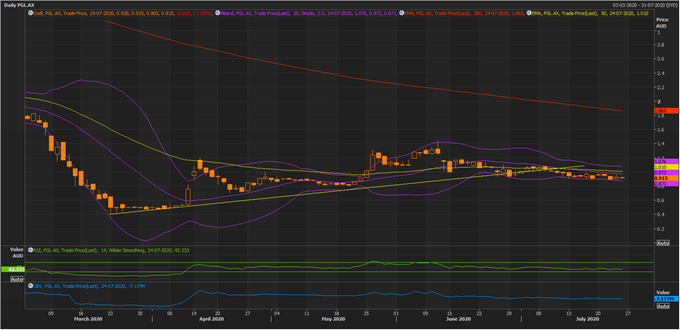
PGL Daily Chart (Source: EODHD/Others Eikon Thomson Reuters)
On the daily chart, the stock is showing lower volatility with the 20-day simple Bollinger band shrinking and the On Balance Volume flattening.
- However, the stock has breached the support of the short-term trendline is currently hovering near the -2 SD of the band, which is now the last support level.
- Furthermore, PGL is trading below the 200-day EMA and also below the 50-day EMA, suggesting that the primary trend is a downtrend.
- The 14-day RSI is also flat along with the recent price action, reflecting on the tiredness of bulls on rallying the stock.
- In mid-June, the stock witnessed a down gap, post which bulls attempted to full it; however, remained unsuccessful and bears took charge with the next day trading candle breaching the low of the bullish candle.
- Since then, the stock is flat and sloping downwards, which could seed bearish sentiments ahead.
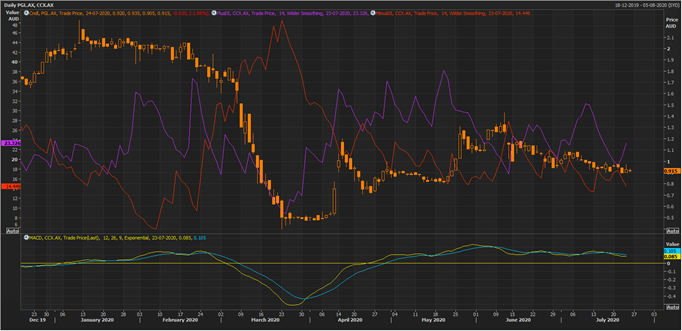
PGL Daily Chart (Source: EODHD/Others Eikon Thomson Reuters)
On applying directional signals, it could be seen that the gap between the plus DI and the minus DI is now narrowing down; however, are yet to give any negative signal as the stock is presently taking the support of the -2 SD of the Bollinger band.
- Though the 12,24,9 MACD, which gives higher weightage to the recent price action, is now showing a negative signal with the signal line trading below the MACD line.
Independence Group NL (ASX:IGO)
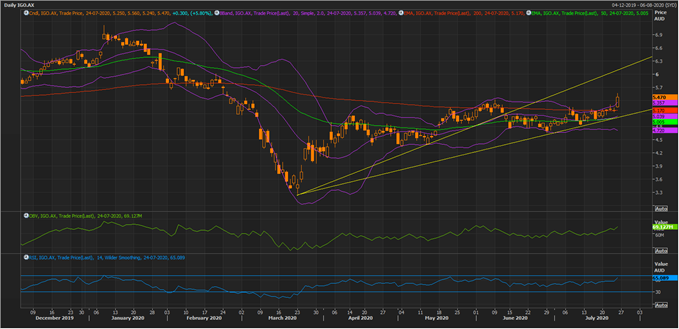
IGO Daily Chart (Source: EODHD/Others Eikon Thomson Reuters)
On following the daily chart, it could be seen that IGO has taken a rebound from its short-term trendline support to trade and sustain above the 200-day and 50-day EMA, suggesting that bulls are currently taking charge.
- The stock has given a volatility breakout as well with the price trading and closing above the +2 SD of the Bollinger band.
- If the price further sustains and confirms the volatility breakout, it could further bullish sentiments ahead.
- Both the On Balance Volume and 14-day RSI are now picking momentum and sloping upwards, suggesting that the stock rise is well supported by both volumes and bullish sentiments.
- The 14-day RSI is currently above the mean value; however, is quickly approaching the overbought zone of 70, and the historical evidence suggests that post touching 70, the RSI takes correction; however, it should also be noticed that each successive low of RSI is higher than the previous low, which in turn, further suggests that bulls take charge on every single dip.
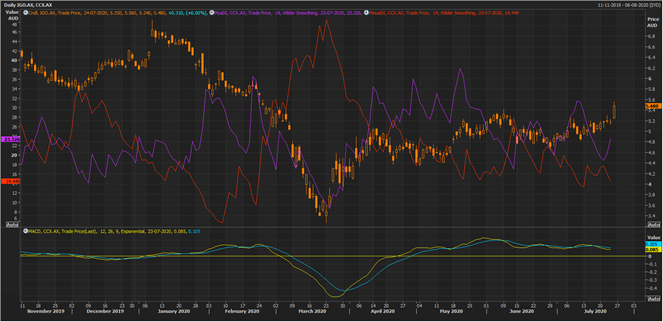
On applying the directional signal, it could be seen that post narrowing down for a while, the pair of plus DI and minus DI is now showing an increased spread, which is in tandem with the recent price action.
- So far, the plus DI and minus DI have shown a failed negative cross during early mid-June.
- However, the 12,24,9 MACD indicator is showing a negative signal.
In a nutshell, with the consolidation of S&P/ASX 200 Index, some stocks are showing consolidation with a downward slope, while some are yet standing tall. Stocks such as City Chic and PGL are showing a breach of the near-term upward sloping trendline and clinching above volatility support, while some like IGO are yet showing a bullish sentiment, despite consolidation in the major equity index due to its exposure in the copper and nickel market.
To Know More, Do Read: Commodity Stocks Making Their Way To The Top
