


Summary
- Gold prices are shattering all records as investors rush to buy gold.
- The surge in gold prices is well supported by a large gold purchase from the global gold-backed ETFs along with central banks.
- Gold has now emerged as a perfect hedge.
- However, while the gold spot market is reaching sky-high, ASX-listed gold stocks are not lagging behind with some even outperforming returns from gold so far.
- While there has been a lot of uncertainty around the shape of the global recovery, it could be said that market is not falling short in taking some extra risk, leading to a gush in gold stocks over the exchange.
- Four gold stocks showing interesting development on charts.
Gold prices are skyrocketing in the market and investors seem to be developing interest in the gold exposure while taking a little extra risk, leading to a gush in ASX-listed gold stocks, many of these stocks are now trading at either the record high or a 52-week high.
The rally in the gold spot market is well supported by a record purchase from global gold-backed ETFs along with the increasing need of the market participants to hedge their portfolio.
To Know More, Do Read: Gold Supply Disruptions and Paradigm Shift in Gold Miners’ Business Strategy
However, while there has been a lot of uncertainty around the global recovery, which is morphing into a W-shaped recovery, it could be said that market is not lagging behind in taking some risk, inferring from the recent rally across global equity indices.
Likewise, in the gold sector, higher returns delivered by many ASX-listed gold stocks such as Saracen Mineral Holdings Limited (ASX:SAR) against gold, is somewhat depicting the same picture.
To Know More, Do Read: Gold Player That Has Beaten Guidance Over Many Years! Strong Tailwinds An Icing on the Cake
Moreover, in the wake of a gush in the gold spot price, many ASX-listed gold stocks are shattering all records and showing some interesting development on charts.
To Know More, Do Read: Gold Hits life highs: Eight ASX-listed Gold Stocks Under Sentiment Splash
ASX-listed Gold Stocks on Charts
- Northern Star Resources Limited (ASX:NST)

NST Daily Chart (Source: EODHD/Others Eikon Thomson Reuters)
On following the daily chart of the stock, it could be seen that NST is moving in an uptrend since December 2019, when gold prices picked up slight momentum, to move above the 200-day exponential moving average.
- However, post a continuous surge for a short-term, the stock dipped in February 2020 amidst the COVID 19 market crash and consolidation in gold.
- The recent rally in gold along with an impeccable June 2020 quarter again propelled the stock with prices turning into a short-term uptrend.
- In the recent few trading sessions, NST had attempted a volatility breakout with prices breaching the +2 Standard Deviation (or SD) of the 20-day simple Bollinger band; however, failed to sustain the breach and corrected slightly.
- While the surge in the stock price was well supported by the rise in volumes, as indicated by an upward sloping On Balance Volume (or OBV), the 14-day RSI is showing a slight correction from the overbought zone.
On the resistance counter, it could be seen that the stock breached the support of an upward sloping trendline previously, the extension of which, NST attempted to test, however failed to hold.
- The same trend line, along with the recent high price, should act as immediate resistance for the stock.
On the support counter, the primary support for the stock is at the mean value of the Bollinger band, which is quite decisive as well, as it is overlapping with the 50-day EMA.
- Saracen Mineral Holdings Limited (ASX:SAR)
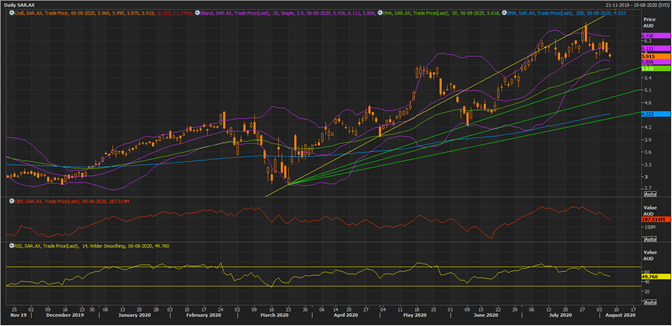
SAR Daily Chart (Source: EODHD/Others Eikon Thomson Reuters)
On following the daily chart, it could be seen that the stock attempted a resistance as well as a volatility breakout, to test the extension of the previous trendline while simultaneously testing the +2 SD of the 20-day simple Bollinger band.
- However, the stock failed to breach and sustain the attempt on both the resistance and +2 SD and corrected to test the mean value of the Bollinger band.
- The stock has been moving in an uptrend with the price trading above the pair of 200- and 50-day EMA.
- At present, SAR is hovering around its support zone of -2 SD, which is both, immediate support and decisive support (as overlapping with the 50-day EMA).
- A breach below the same support zone could seed bearish sentiments.
Furthermore, the OBV is now sloping downward in tandem with the price action while the 14-day RSI is also correcting from the overbought zone to hover around its mean value.
- Gold Road Resources Limited (ASX:GOR)
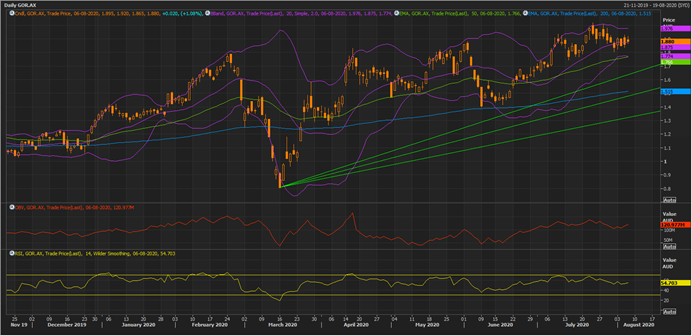
GOR Daily Chart (Source: EODHD/Others Eikon Thomson Reuters)
On following the daily chart, it could be seen that the stock is moving in an uptrend with the price trading above the pair of 200- and 50-day exponential moving average.
- SAR recently tested the +2 SD of the 20-day simple Bollinger band; however, failed to give any volatility breakout and revised towards the mean of the band.
- Post a slight correction, the stock took the support of the mean value of the Bollinger band and is once again showing a slight upside momentum with both the OBV and 14-day RSI turning upwards.
- It should also be noticed that while the stock reverted to the mean value of the Bollinger band, the 14-day RSI also reverted to its mean, and both, the price and the 14-day RSI are now moving up, suggesting bullish participation on the dip.
On the resistance counter, the recent high should act as immediate resistance for the stock, break and price action above which, could seed further bullish sentiments.
Likewise, on the support counter, the mean value of the Bollinger band could act as immediate support followed by decisive support of -2 SD, which is overlapping with 50-day EMA.
- Regis Resources Limited (ASX:RRL)

RRL Daily Chart (Source: EODHD/Others Eikon Thomson Reuters)
On following the daily chart, it could be seen that RRL is currently trading in an uptrend with prices exchanging hands above the pair of 200- and 50-day EMA.
- Furthermore, the stock is now testing the upper limit or +2 SD of the 20-day simple Bollinger band while witnessing strong volume support, as inferred from an upward sloping OBV.
- Moreover, the Bollinger band is showing a squeeze while the stock is trailing higher along with an upside slope in both the OBV and 14-day RSI, reflecting that soon the stock should enter a directional trend.
- The direction of the trend would depend upon RRL’s ability to breach and sustain above/below its resistance/support.
On the resistance counter, the recent high should act as immediate resistance while on the support counter, the mean value of the Bollinger band should act as immediate support, followed by decisive support of -2 SD, which is overlapping with the 50-day EMA.
