
 AUS
AUS
 NZ
NZ
 UK
UK
 CA
CA
 USA
USA
 IND
IND






SRG Global Limited (ASX: SRG) is an industrial sector company that specialises in construction, maintenance and mining services. In 2018 the company got merged with Global Construction Services Ltd.
On 27th May 2019, the company informed the exchange that it has secured a long-term contract with South32 Worsley Alumina. SRG Global will provide a complete gamut of engineering solution for South32, including skilled rope access technicians and scaffold services.
Initially, the contract would be for three years with an option to extend it up to three more years. The work set to commence in June 2019 with expected revenue generation of $32 million over initial three years and $60 million over the six-year.
David Macgeorge, Managing Director of SRG Global, highlighted that the opportunity to work with South32 is a great achievement for SRG Global. The contract also solidifies the companyâs loing term strategy to deliver recurring term revenue within the asset services sector.
On 9th April 2019, the company secured $18 million contract with KCGM joint venture.
Technical Outlook
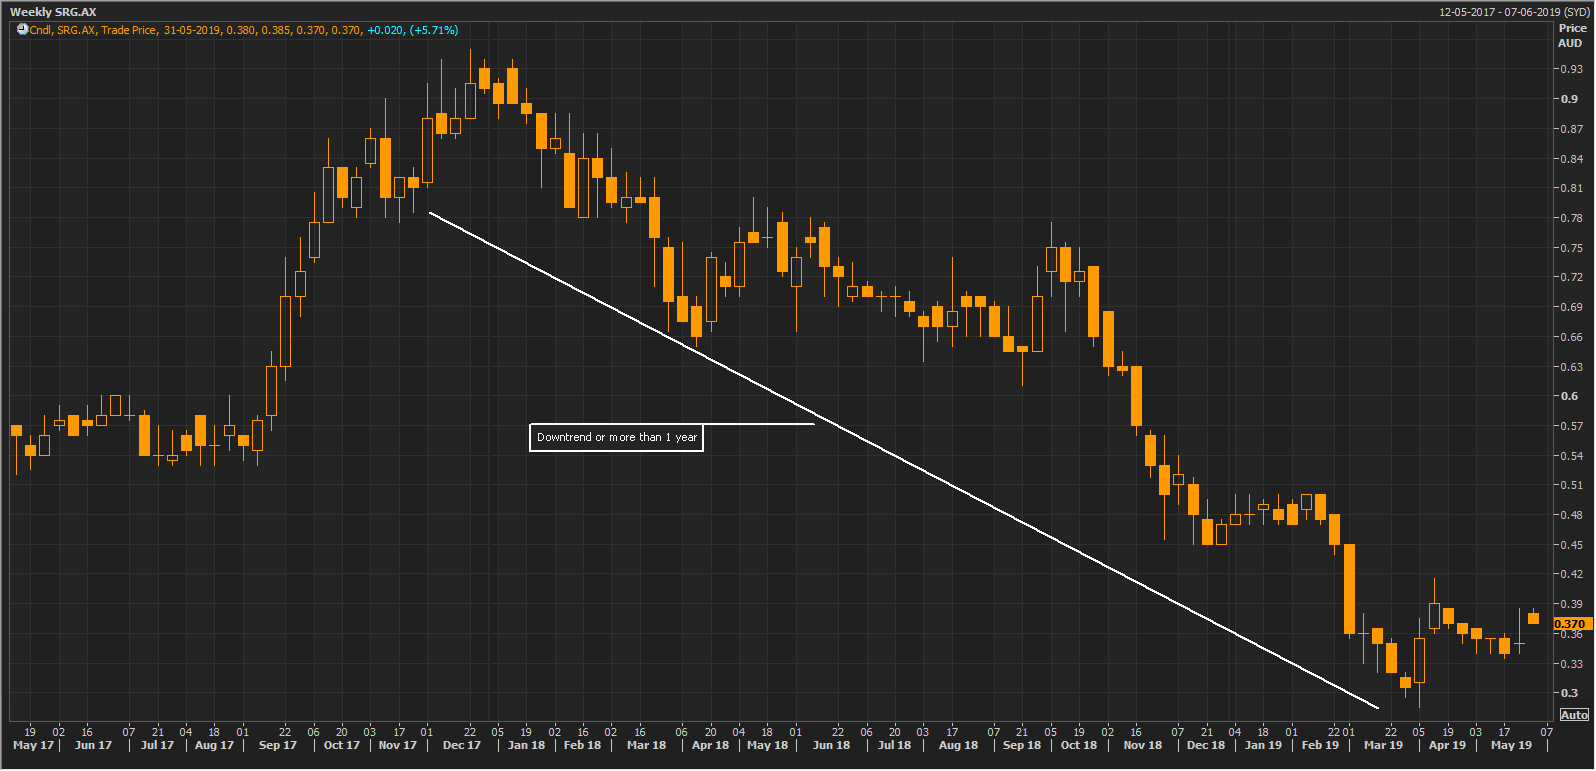 Weekly Price Chart of SRG Global Limited (Source: Thomson Reuters)
Recently on 2nd April 2019, the stock had made its 52-week low of A$0.285, which is even valid as of 28th May 2019. Prior to the 52-week low, the stock was in a continuous downtrend from the beginning of 2018. Even before the stock made its 52-week low the Relative Strength Indicator (RSI) was already in the oversold zone.
RSI is a momentum indicator which depicts an oversold zone when its value reaches below 30. This zone depicts that the prices have fallen quite a lot in the recent time frame, or the stock momentum is over stretched and is ready for change or pause of its previous underlying trend.
At such chart set ups the stock price tends to bounce from the lower levels and the buying demand starts to kick in and shoots the prices higher, at least for a short period of time.
As per RSI, the buying opportunity emerges when the value of RSI goes above 30, which is what happened on 3rd April 2019, the price started to increase, and RSI closed the day with a reading of over 30.
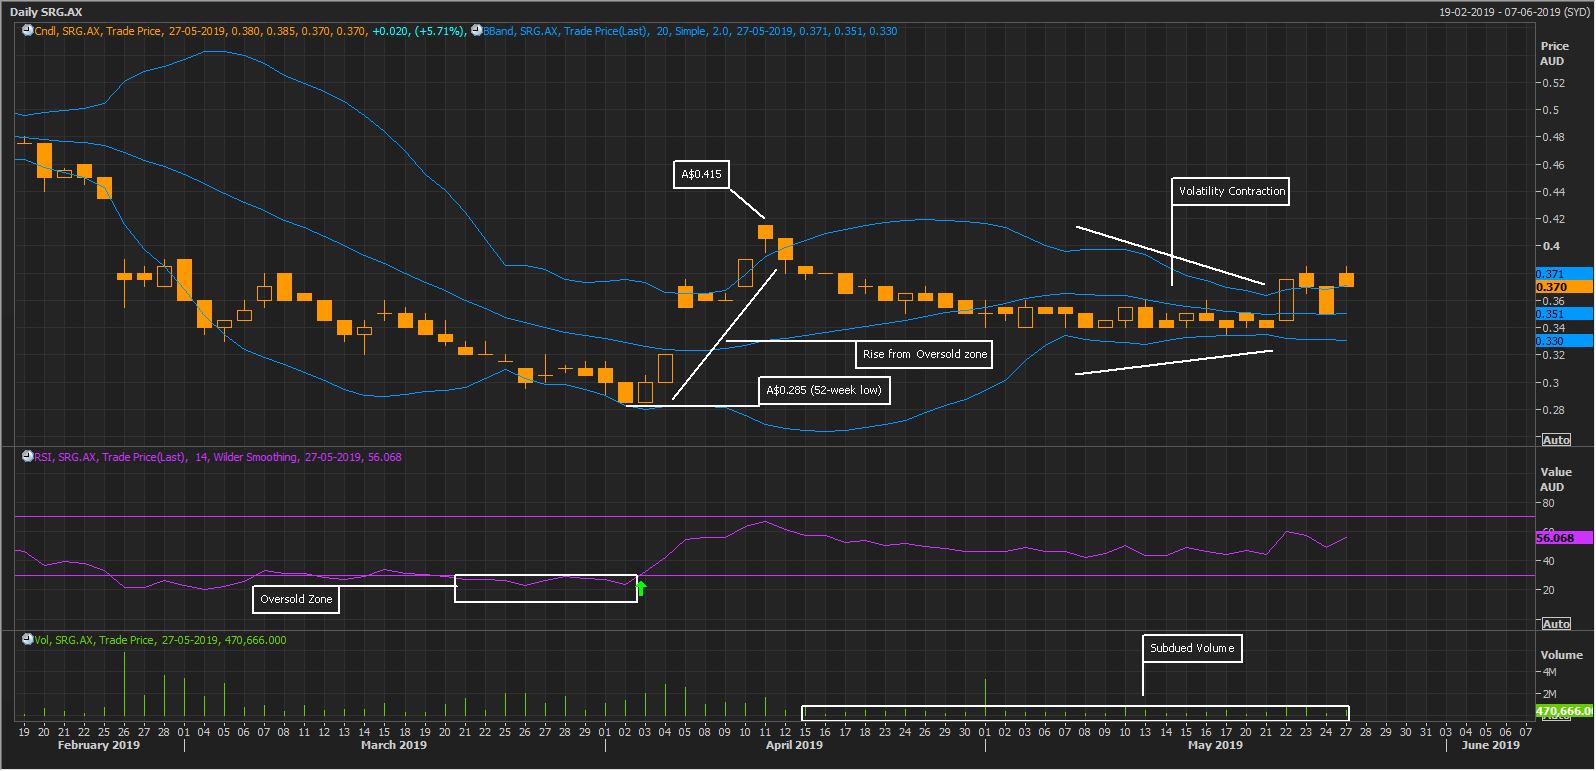 Daily Price Chart of SRG Global Limited ((Source: Thomson Reuters)
After this, the stock rose for a short term and rallied to a high of A$0.415 and then started to consolidate in a range. In this entire range, the volume action had remained subdued. The price squeeze was depicted by the Bollinger band as a contraction in the volatility. As the volatility started to come down, the bands also started to squeeze.
This contraction in volatility also represents a possible emergence of an expected move because of the mean reversion property of the volatility. In simple words, when the volatility is low, it is expected to touch its mean (which would be on a higher side) and vice versa. This expansion in volatility results in a move in the stock, the direction of which is uncertain.
As of 28th May 2019, the stock has started to show some activity (today up by 2.703%) and is trying to trade outside the band, which could result in increased volatility going forward.
Stock Performance
The company has a market capitalisation of A$162.95 million, and the stock had touched a 52-week high and low of A$0.780 and A$0.285 respectively. The stock closed the dayâs trading session at A$0.380 on ASX (as on 28 May 2019), up by 2.703%. The last one-year return of the stock is -47.89%, and the YTD return stands at -26.00%.
Disclaimer
This website is a service of Kalkine Media Pty. Ltd. A.C.N. 629 651 672. The website has been prepared for informational purposes only and is not intended to be used as a complete source of information on any particular company. Kalkine Media does not in any way endorse or recommend individuals, products or services that may be discussed on this site. Our publications are NOT a solicitation or recommendation to buy, sell or hold. We are neither licensed nor qualified to provide investment advice.
