


Microsoft Corporation (NASDAQ:MSFT) founded in 1975, is a well-established technology company. Its product portfolio includes operating systems, cross-device productivity applications, server applications, business solution applications, tools related to desktop, server management and software developments, etc. The company is also engaged in designing, manufacturing, and selling of devices such as PCs, tablets, gaming and entertainment devices, etc. MSFT offers a range of services, which include cloud-based solutions, solution support and consulting services along with online advertising to the global audience.
The company caters the demand by offering its services through three key business verticals; Intelligent Cloud, More Personal Computing and Productivity and Business Processes.
The company recently announced its 2019 fourth quarterly earnings, beating the market estimates. Earnings in the fourth quarter were proved to be a record in terms of its largest in the world commercial cloud business, crossing $38 billion top line mark for FY19, with gross margins increasing to 63%. With this, the company delivered the full year 2019 revenues of over $125 billion with double-digit growth in top line and bottom line. The excellent results owed to its long-term partnerships with the leading businesses in their respective space. MSFT assists its customers to create their own digital capability with innovative products, creating new businesses for them. The company enjoys a strong relationship with its customers in the form of multi-year commercial cloud agreements.
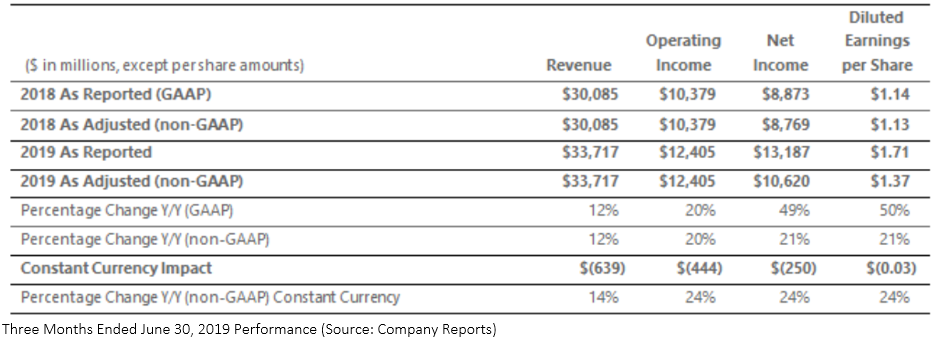
Key Highlights of Fourth Quarter Earnings 2019: The companyâs top line increased by 12% to $33.7 billion, with operating income growth of 20% to $12.4 billion for 4Q FY19. GAAP and Non-GAAP net income for the period amounted to ~$13 billion and ~$11 billion, recording a growth of ~49% and ~21%, respectively. For the period, diluted EPS (earnings per share) came in at $1.71, posing an exuberant Y-o-Y growth of 50%. Â Non-GAAP EPS at $1.37 increased 21% on a Y-o-Y basis. During the period, under the share repurchase program, the company gave back $7.7 billion to its shareholders.
Segment Wise Performance in 4QFY19:
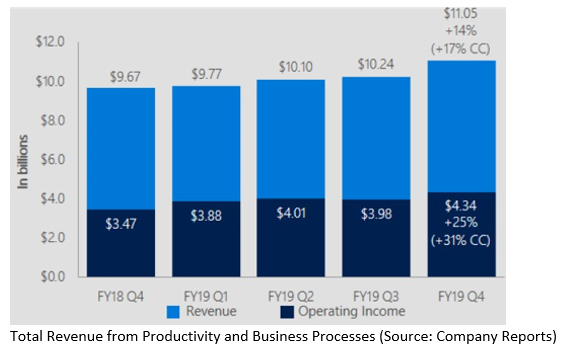
Productivity and Business Processes: The segment posted revenues of $11.0 billion, which increased 14% on a Y-o-Y basis. In CC (Constant Currency), the revenues were up 17%. Gross margin dollars rose 16% (up 20% in CC) with an increase in gross margin percentage driven by improvements seen in cloud engineering and LinkedIn. Operating income for the segment also posted an excellent growth of 25% (up 31% in CC).
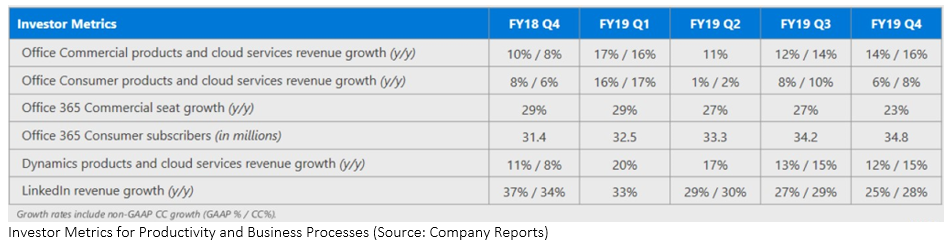
Within the segment, total sales from cloud services and Office Commercial products saw a rise of 14% and 16% in CC. The higher growth was driven by Office 365 Commercial revenues, which grew by 31% (up 34% in CC). Revenues from Office Consumer products & cloud services witnessed a rise of 8% in CC and 6%. Consumer subscribers for Office 365 reached 34.8 million during the period. Revenues from LinkedIn went up by 25% and 28% in CC, with a whopping growth of 22% seen in the LinkedIn sessions. Revenues from Dynamics products & cloud services posted a growth of 12% (up 15% in CC), which was led by growth of 45% in Dynamics 365 revenue (up 48% in CC).
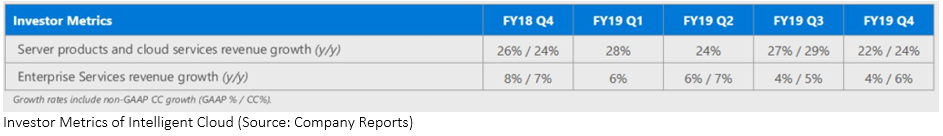
Intelligent Cloud: The segment recorded a revenue of $11.4 billion, posting a growth of 19% (up 21% in constant currency), largely on the back of server products and cloud services. Gross margin dollars saw a rise of 19% (up 21% in CC). Gross margin in percentage terms did not see any major change, with a gross margin percentage improving for Azure. A 23% rise in operating expenses (up 24% in CC) was on account of funds invested in the cloud and Artificial Intelligence engineering, etc. Operating income for the period witnessed a growth of 15% (up 19% in CC).

The growth was largely led by Server products and cloud services, which saw a 22% increase in revenues (up 24% in constant currency) on account of 64% revenue growth from Azure (up 68% in constant currency). Moreover, enterprise mobility installed base rose 41%, reaching to more than 116 million seats. Revenues from Enterprise Services saw an increase of 4% (up 6% in constant currency).
More Personal Computing: Â Total sales from the segment accounted for $11.3 billion, with a rise of 4% (up 6% in CC). Gross margin dollars expanded to 8% (up 10% in CC). Gross margin percentage witnessed a marginal increase, driven by a rebalancing in revenue mix towards higher gross margin Windows businesses. During the period, operating expenses witnessed a fall of 2% (down 1% in CC), with operating income growth of 18% (up 22% in CC).
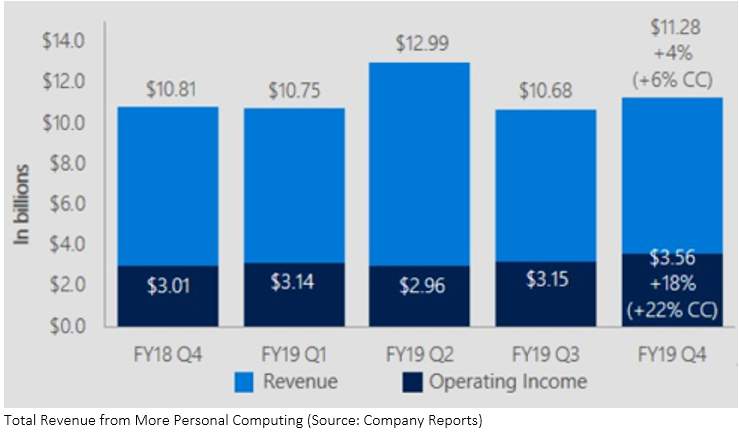
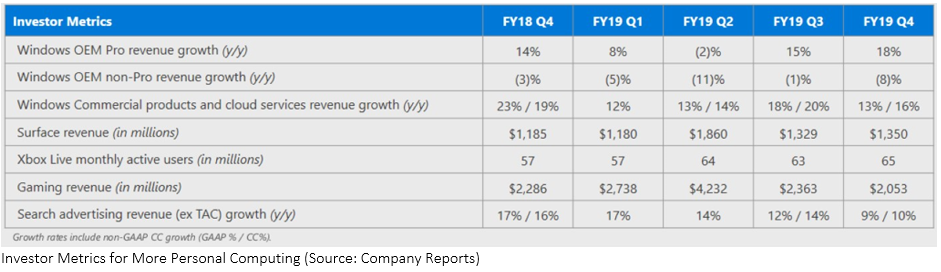
Revenue from Windows OEM was up 9%, with the same growth in CC. Windows commercial products & cloud services revenue went up 13% (up 16% in CC), on the back of rise in multi-year agreements, which carried higher in quarter sales recognition. Revenue from Surface posted a growth of 14% (up 17% in constant currency), largely driven by strong growth in the commercial segment. Search advertising (ex-traffic acquisition costs) posted revenue growth of 9% (up 10% in CC). However, sales from Gaming witnessed a fall of 10% (down 8% in CC) with Xbox software and services revenue declining 3% (down 1% in CC).
Free Cash Flow at the End of 4Q 2019: Net cash flow from operations stood at $16,108 million, up 41% (Y-o-Y) on the back of strong cloud billings and collections and ~8 points of benefits from tax payments in FY18. Free cash flow for the period stood at $12,057 million after adjusting the investment in property and equipment during the period, reflecting a rise of 62% Y-o-Y.
Capital Expenditure: During the period, CapEx, including assets acquired under finance leases stood at $5.3 billion. The CapEx was incurred to support the growth of cloud services. The company paid an amount of $4.1 billion related to the property and equipment during the period.
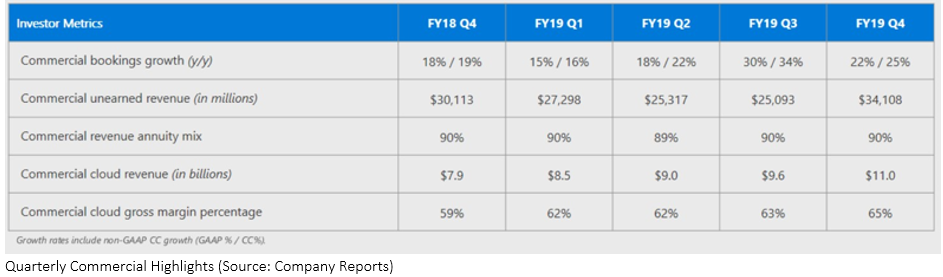
Quarterly Commercial Highlights: Commercial cloud business saw strong results driven by increased customer commitments. Commercial bookings saw a growth of 22% (up 25% in CC), which was led by a number of larger, long-term Azure contracts. Commercial unearned revenues of $34.1 billion witnessed a Y-o-Y growth of 13%, with commercial revenue annuity mix of 90%. On the Commercial Cloud front, revenues stood at $11 billion with a Y-o-Y increase of 39% (up 42% in CC). Gross margin percentage for space came in at 65%, up 6 pts Y-o-Y, which was largely due to substantial improvement in Azure gross margin.
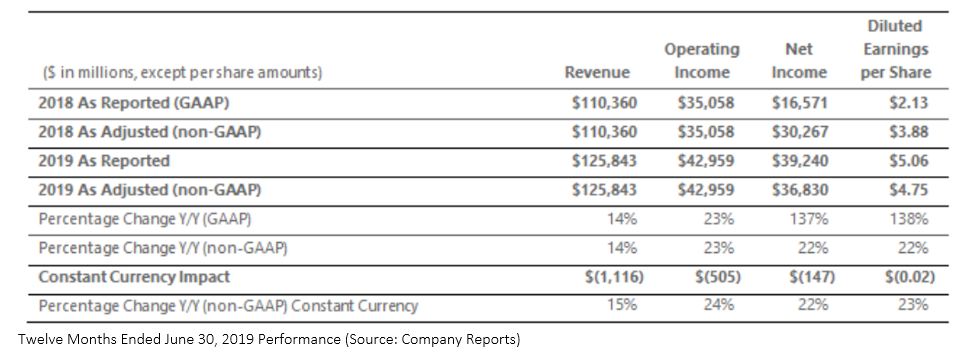
Key Highlights of FY19 Results: With the announcement of its 4Q results, the company also came up with the fiscal year 2019 results, wherein revenues witnessed a growth of 14% to $125.8 billion, whereas operating income amounted to $43 billion with a Y-o-Y growth of 23%. Net income for the period amounted to $39.2 billion, up 137% while non-GAAP net income of $36.8 billion increased by 22% in the corresponding period last year. GAAP and non-GAAP diluted EPS for the period stood at $5.06 and $4.75, recording a growth of 138% and 22%, respectively.
Outlook: Â Given the foreign currency impact, the company expects its revenue growth to decrease by 1 point along with COGS (cost of goods sold) fall of ~1 point in FY20. Growth in the operating expenses is expected to be between 11% to 12% during FY20. The Management intends to continue the capital expenditure to cater to the demand emerging from the could services. Effective tax rate during FY20 is expected at ~17%.
At the current market price of $136.42, the stock is available at the price to earnings multiple of 30.32x, with current dividend yield of 1.34%. The stock is currently trading towards its 52-week high level of $139.54.
Disclaimer
This website is a service of Kalkine Media Pty. Ltd. A.C.N. 629 651 672. The website has been prepared for informational purposes only and is not intended to be used as a complete source of information on any particular company. Kalkine Media does not in any way endorse or recommend individuals, products or services that may be discussed on this site. Our publications are NOT a solicitation or recommendation to buy, sell or hold. We are neither licensed nor qualified to provide investment advice.
