


Crude prices are on a bull side, with Brent Crude spot (XBR) marking another rally from the level of $63.88 (dayâs low on 8th March 2019) to the level of $68.03 (dayâs high on 14th March). The WTI crude is following the same trajectory, with WTI Crude spot marking a surge from the level of $54.37 (dayâs low on 8th March) to the level of $58.64 (dayâs high on 14th March).
Crude oil prices are rising as market participants notice a relief sign in the surging U.S. Crude oil inventory. The U.S. Weekly crude oil inventory marked a decline to 3.9 million barrels for the week ended 8th March.
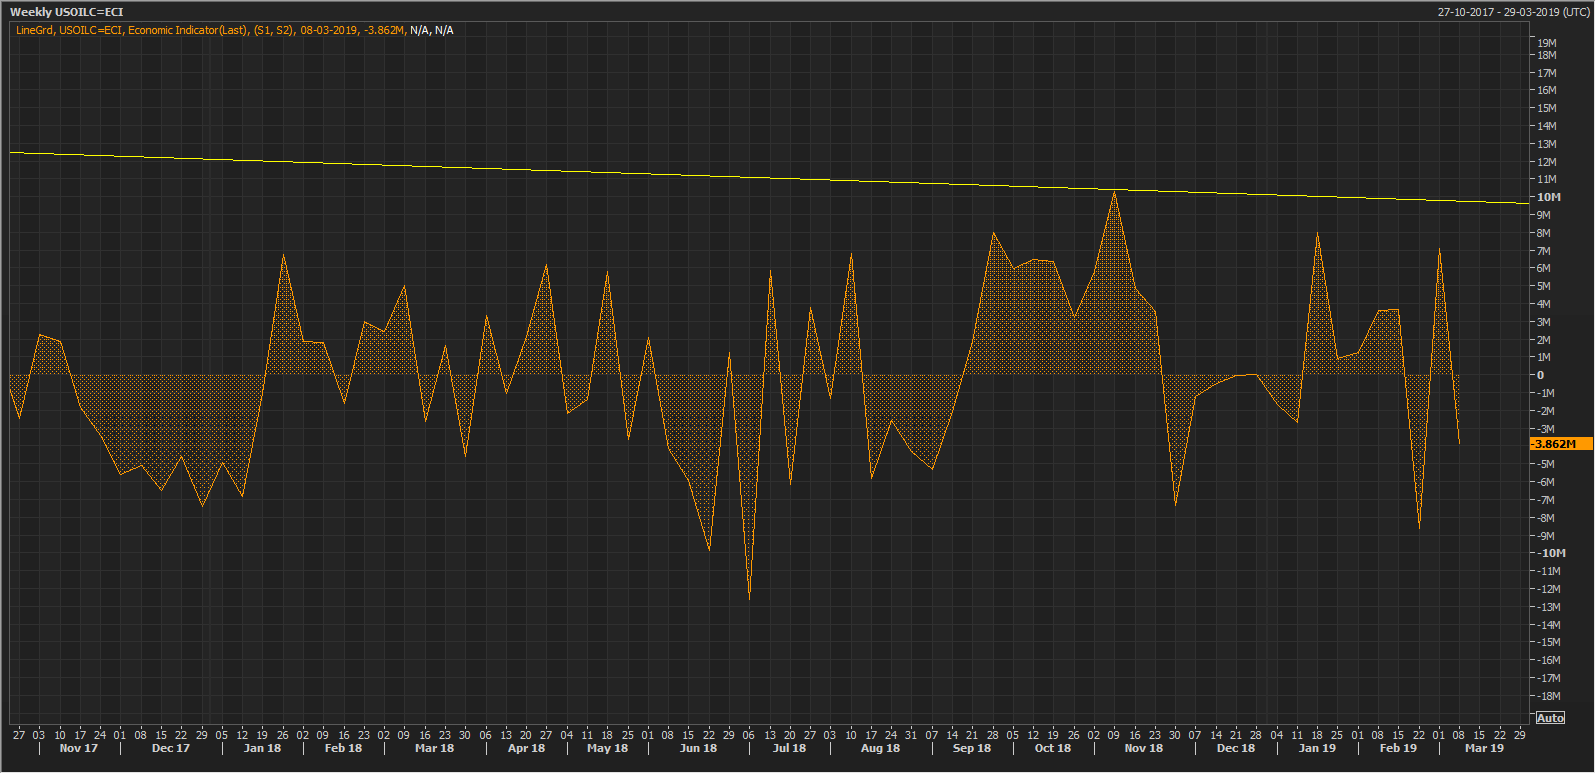
Source: Thomson Reuters (U.S. weekly Crude Oil Inventory)
The U.S. Weekly crude oil inventory fell for the first week of March after a steep rise in inventory to the production level of 7.1 million barrels for the week ended 1st March, against the market expectation of 2.7 million barrels.
The fall in U.S. crude oil weekly inventory more than the estimation of the market provided an impetus to the crude oil prices.
As can be seen on the above chart that the U.S. Crude output is moving downside and the high is marked at 10.270 million barrels for the week ended 9th November 2018. The progressive decline in crude inventory raised concern among the market participants over a supply crunch.
Another factor which is supporting the view of crude supply crunch is the voluntary production cut by the OPEC members to support the crude oil prices.
The reason for the crude prices to mark an uptrend is the supply crunch in the market coupled with steady demand. The U.S. ban on Venezuela and Iran, the major exporter of Crude oil is supporting the crude oil.
The U.S ban on Venezuela state-owned PDVSA to pin down the current president Nicolas Maduro and support the opposition leader Juan Guaido led to a net decline in the Venezuela crude oil production and export. The ban chocked the market over the supply and supported the crude oil prices.
The U.S. sanctions on major top oil producer Iran on account of Tehranâs nuclear ambitions further prompted the supply disruption. Crude oil prices, which were in shackles amid the higher output from the U.S. and lowered domestic consumption of the oil in the country, now seems to loosen its shackles over the declining production from the U.S. and further disruption in the supply chain caused by its ban on significant oil exporters.
Technical outlook:
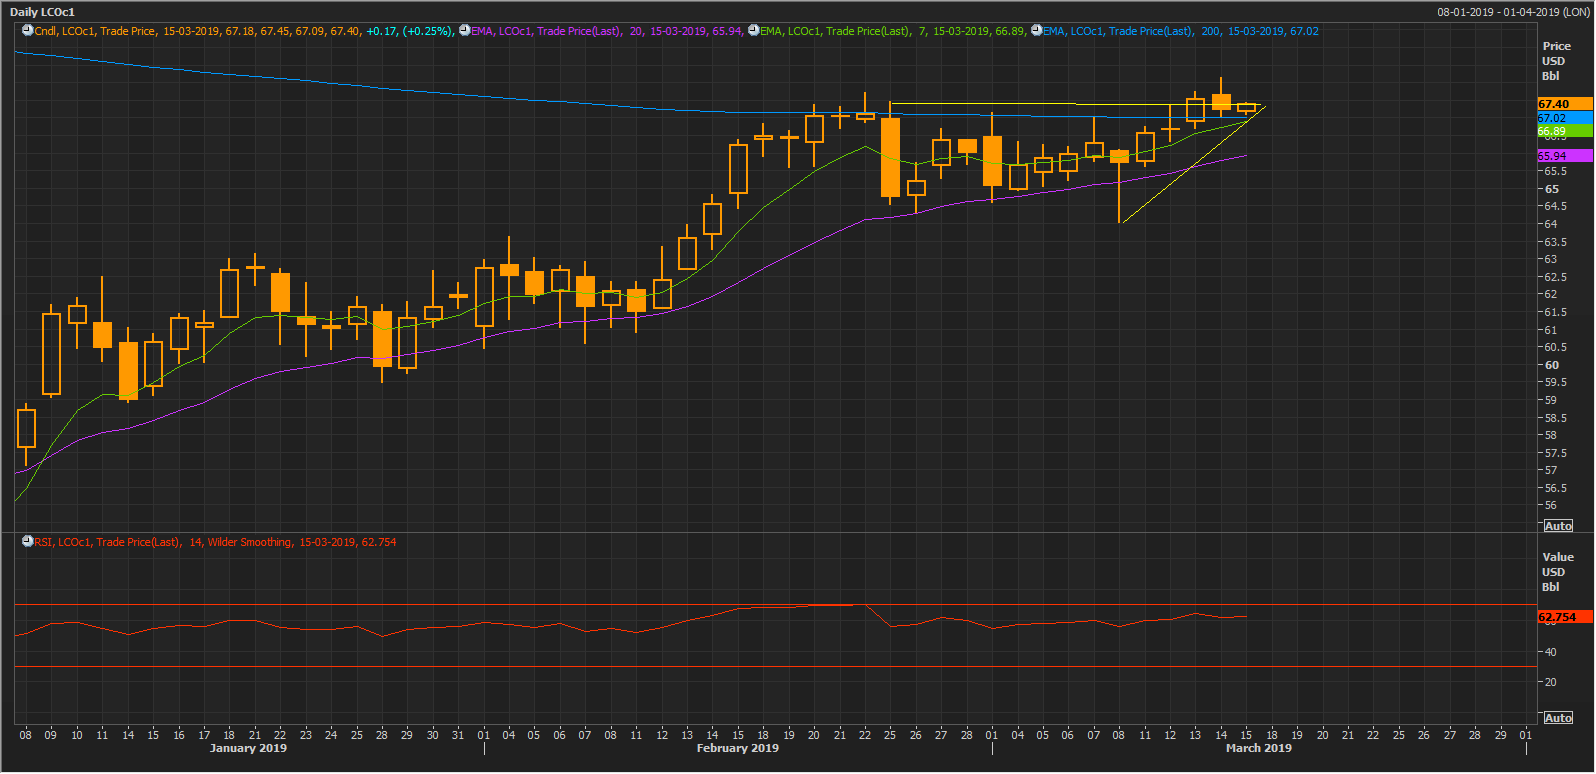
Source: Thomson Reuters (Brent Crude oil futures Daily chart)
Following the development on the daily chart, the Brent oil future (Lcoc1) is currently trading above its 200-day exponential moving average (EMA), which is valued at $67.02. On the daily charts, the prices crossed the resistance of the ascending triangle pattern, which indicates the bullâs strength. The shorter 7-days exponential moving average is well placed at $66.89, and medium term 20-days exponential moving average is placed at $65.94. The 7-days EMA is right below 200-days EMA and could give a golden cross-over. The Relative Strength Index (14) is well above its mean value of 50 and is marked at 62.75.
Disclaimer
This website is a service of Kalkine Media Pty. Ltd. A.C.N. 629 651 672. The website has been prepared for informational purposes only and is not intended to be used as a complete source of information on any particular company. Kalkine Media does not in any way endorse or recommend individuals, products or services that may be discussed on this site. Our publications are NOT a solicitation or recommendation to buy, sell or hold. We are neither licensed nor qualified to provide investment advice.
