


Highlights
- PolyNovo delivered AUD 118.6 million in FY25 sales, up 28.9% YoY, with recurring demand secured in new international markets.
- EBITDA guidance of AUD 11.2–12.4 million for FY25 represents a sharp rise from AUD 3.6 million in FY24.
- The company plans AUD 8.5 million in FY26 capital expenditure for a new manufacturing facility and R&D Innovation Centre to support global expansion.
PolyNovo Limited (ASX:PNV) is an Australia-based medical device company specialising in dermal regeneration solutions. The company develops and manufactures products based on its patented NovoSorb® bioabsorbable polymer technology, which is utilised in advanced wound care applications through its NovoSorb® BTM and NovoSorb® MTX products.
Financial Performance
For the financial year ended 30 June 2025 (FY25), the company achieved NovoSorb BTM and MTX sales of AUD 118.6 million, representing a 28.9% YoY increase from AUD 92.0 million in FY24. During the reported period, the company witnessed sales momentum across the U.S. and international markets. The U.S. sales grew approximately 28.7% YoY, while sales in Rest of World markets increased by 29.6% YoY.
In FY25, the company also expanded its footprint into new territories, recording first-time sales of NovoSorb® BTM in Malaysia, the Czech Republic, Malta, Portugal, and Peru. Notably, recurring orders have now been secured across all these markets.
PolyNovo’s cash balance at the end of June 2025 stood at AUD 33.5 million, compared to AUD 45.9 million in FY24, reflecting capital expenditure and debt repayment. However, operating cash flow showed a marked turnaround in the second half of FY25, delivering an inflow of AUD 15.7 million versus an outflow of AUD 12.5 million in the first half.
Business Update
On 12 August 2025, the company disclosed that JPMorgan Chase & Co. and its affiliates, a substantial shareholder in the company, had reduced their voting power from 9.02% to 7.77%.
Outlook
In FY25, the company expects EBITDA to range between AUD 11.2 million and AUD 12.4 million, significantly higher than the AUD 3.6 million recorded in FY24. To support future growth, the company has earmarked AUD 8.5 million in capital expenditure for FY26 to complete its new manufacturing facility and R&D Innovation Centre. These investments will be funded through operational cash flow and the collection of AUD 6.9 million in overdue U.S. receivables.
With growing sales contributions from Australia, New Zealand, the UK, and the U.S., management expects profit momentum to carry forward into FY26.
PolyNovo will release its full FY25 results on 25 August 2025.
Share performance of PNV
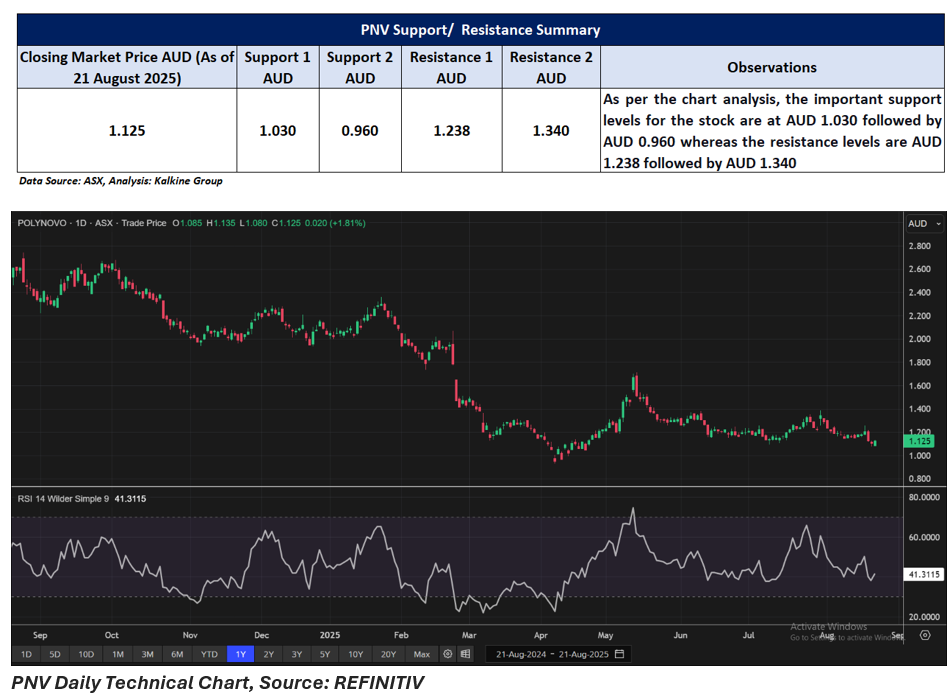
PNV shares rose 1.81% intraday to close at AUD 1.125 per share on 21 August 2025. Despite the daily gain, the stock has fallen 4.66% over the past week and is down 9.27% in one month. Over three months, it has dropped 14.12%, while six and nine-month declines stand at 41.10% and 43.47%, respectively. On a yearly basis, PNV has shed 56.90%.
The company’s 52-week high was AUD 2.740, recorded on 26 August 2024, while its 52-week low of AUD 0.930 was reached on 7 April 2025.
Support and Resistance Summary
Note 1: Past performance is neither an Indicator nor a guarantee of future performance.
Note 2: The reference date for all price data, and currency, is 21 August 2025. The reference data in this report has been partly sourced from EODHD/Others.
Technical Indicators Defined:
Support: A level at which the stock prices tend to find support if they are falling, and a downtrend may take a pause backed by demand or buying interest. Support 1 refers to the nearby support level for the stock and if the price breaches the level, then Support 2 may act as the crucial support level for the stock.
Resistance: A level at which the stock prices tend to find resistance when they are rising, and an uptrend may take a pause due to profit booking or selling interest. Resistance 1 refers to the nearby resistance level for the stock and if the price surpasses the level, then Resistance 2 may act as the crucial resistance level for the stock.
Disclaimer
This article has been prepared by Kalkine Media, echoed on the website kalkinemedia.com/au and associated pages, based on the information obtained and collated from the subscription reports prepared by Kalkine Pty. Ltd. [ABN 34 154 808 312; AFSL no. 425376] on Kalkine.com.au (and associated pages). The principal purpose of the content is to provide factual information only for educational purposes. None of the content in this article, including any news, quotes, information, data, text, reports, ratings, opinions, images, photos, graphics, graphs, charts, animations, and video is or is intended to be, advisory in nature. The content does not contain or imply any recommendation or opinion intended to influence your financial decisions, including but not limited to, in respect of any particular security, transaction, or investment strategy, and must not be relied upon by you as such. The content is provided without any express or implied warranties of any kind. Kalkine Media, and its related bodies corporate, agents, and employees (Kalkine Group) cannot and do not warrant the accuracy, completeness, timeliness, merchantability, or fitness for a particular purpose of the content or the website, and to the extent permitted by law, Kalkine Group hereby disclaims any and all such express or implied warranties. Kalkine Group shall NOT be held liable for any investment or trading losses you may incur by using the information shared on our website.
