


Crude oil prices are further climbing ladders with prices of Brent Crude oil futures rising from USD 28.86 per barrel (intraday low on 13 May 2020) to the present high of USD 36.39 per barrel (as on 20 May 2020), which marks a further price gain of ~ 26.09 per cent post recovering from the level of USD 15.98 (intraday low on 22 April 2020).
In the status quo, the scale back in the production from OPEC and members along with a decline in the production from the United States and improved demand indications are propelling the crude up.
While the global demand is estimated to have taken a hit of 30 per cent in the wake of COVID-19 outbreak, industry experts now anticipate that the production scale back from major oil producers could prompt the supply chain to match tune with the overall global demand.
To Know More, Do Read: OPEC Anticipates Fall in Demand for Oil- Supply Chain to Match Tune?
OPEC and members are now further looking to deepen the Declaration of Corporation (or DOC) to extend the deadline of the production cut ahead of June, and while that is a major event which energy market participants are closely looking at, the United States production scale back coupled with a decline in crude oil inventory across the nation (excluding the Strategic Petroleum Reserve) is presently boosting market sentiments along with slight improvement in the demand perspective.
To Know More, Do Read: The Oil Scale Back - A Bedrock for Balancing Demand and Supply Dynamics?
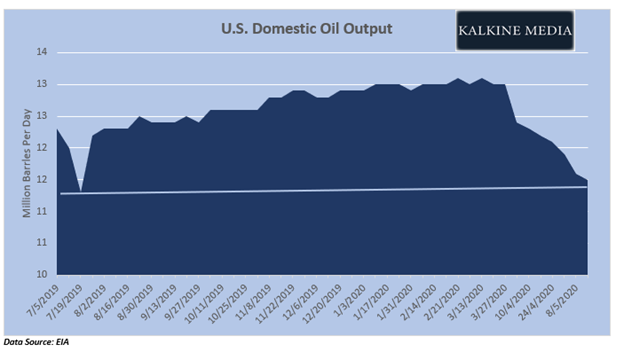
The United States Production Scale Back and The Decline in Active Rigs Count
The weekly crude oil production across the United States extended further decline for the week ended 15 May 2020 to stand at 11.5 million barrels per day, lowest since spiking to to an average of 13.0 million barrels per day at the beginning of the year.
As per the data from the United States Energy Information Administration (or EIA), the number of oil and natural gas drilling rigs declined to a record low (in the database of Baker Hughes) to stand at 339 (as on 12 May 2020), and producers were cutting back production on account of decline in the oil price. The EIA further assessed that the number of active rigs declined by 56 per cent during Mid-March 2020 to stand at 433, and 17.71 per cent of the rigs (or 308 rigs) were in the top-three oil-producing regions.
On the demand counter, crude oil refinery input across the United States averaged 0.5 million barrels per day higher (as on 15 May 2020) to stand at 12.9 million barrels per day while refineries operated at 69.4 per cent of their operable capacity.
The domestic crude oil inventory marked a considerable drawdown with a decline of 5.0 million barrels for the week ended 15 May 2020 after declining by 0.7 million during the prior week to stand at 526.5 million barrels, up by 10 per cent against the five-year average for this time of year.
How Oil Demand And China Stimulus Correlates?
In the status quo, the pace and recovery in the oil market could depend on the outcome of China’s top policy-setting meeting- The National People Congress, which is to take place on 22 May 2020. The market anticipates the NPC to decide on injecting further stimulus to offset the impact of COVID-19 outbreak on the economy, leading towards an increase in economic activities, including construction, manufacturing, which in turn, could further fuel the demand for oil and other commodities ahead.
The Chinese economy witnessed a contraction of 6.8 per cent (y-o-y) during the first quarter of the year; however, OPEC anticipates the GDP to increase by 1.3 per cent in 2020, following on 6.1 per cent growth 2019.
Furthermore, OPEC anticipates the manufacturing activities to continue to pick-up, despite a slight weakness in the manufacturing sector seen in the Caixin China General Manufacturing PMI, which stood at 49.4 in April 2020, down against its threshold value of 50.0 amid a fall in new export orders.
While the Government of China has been supporting the local economy, inferred from slight improvement shown by economic figures for April 2020, the annual NPC meeting is estimated by the market to announce further stimulus.
The Future Market Structure and Current Price Behaviour
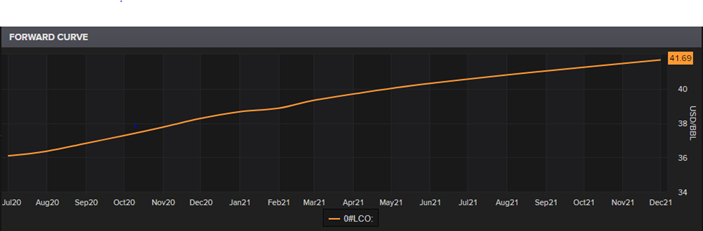
LCO Forward Curve (Source: EODHD/Others Thomson Reuters)
The contango structure of the forward curve steepened further recently post flattening, reflecting on the beginning of recovery in market fundamentals.
The upward-sloping term-structure is further suggesting that the convenience yield of crude futures is now increasing as compared to the storage cost.
The Price Action
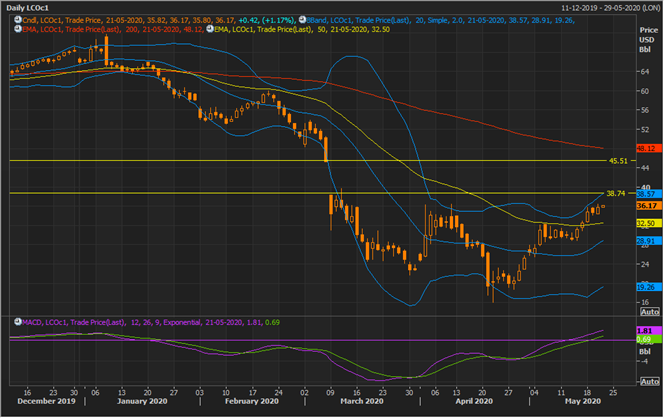
LCO Daily Chart (Source: EODHD/Others Thomson Reuters)
On the daily chart, crude oil prices are trading above the 50-day exponential moving average; however, it is still below the 200-day EMA, reflecting that the current upswing is a pullback in the major downtrend. The commodity is moving up to test the +1 Standard Deviation of the 20-day simple Bollinger band, whose mean value is the 20-day simple moving average.
The current resistance for the commodity is at USD 38.74 per barrel, and it should be noticed that the +1 SD of the Bollinger band and the resistance line are overlapping, suggesting that the current resistance could act as a decisive zone for the future moves ahead, and investors should monitor the zone closely to navigate the volatile oil market ahead.
A break and move above the suggested resistance could boost bullish sentiments while failure to do so would seed bearish sentiments.
Also, the mean revision theory of technical analysis also suggest that an asset normally test the +- 1 SD before retracting back to the mean; thus, over the short-run the 20-day SMA or the mean value of the Bollinger band should act as the primary support, followed by -1 SD, while 50-day EMA should act as immediate support.
The 12,26,9 moving average convergence and divergence indicator is giving a positive signal on the daily timeframe, which coupled with an expanded Bollinger band suggest that the prevailing sentiments are bullish in nature.
