


ASX-listed oil and energy stocks are picking up some momentum while the oil market awaits further development in the energy space with prices reaching near the short-term resistance level. On the domestic front, the S&P/ASX 200 Energy Index is showing recovery from the recent bottom with a gain of ~ 47.92 per cent from the level of 4,960.80 (intraday low on 23 March 2020) to the present level of 7,338.50 (as on 11 May 2020 11:38 AM AEST).
The Brent Crude oil futures is hovering around USD 30 per barrel from past few trading session while resistance remains untested around USD 31 to USD 32 level; however, while the Brent futures is yet to cross its short-term resistance the S&P/ASX 200 Energy Index has successfully tested the resistance but remains unable to penetrate it.
To Know More, Do Read: Crude Rally Halts: How is the Oil Market Poised?
S&P/ASX 200 Energy Index on Charts
- Daily Chart
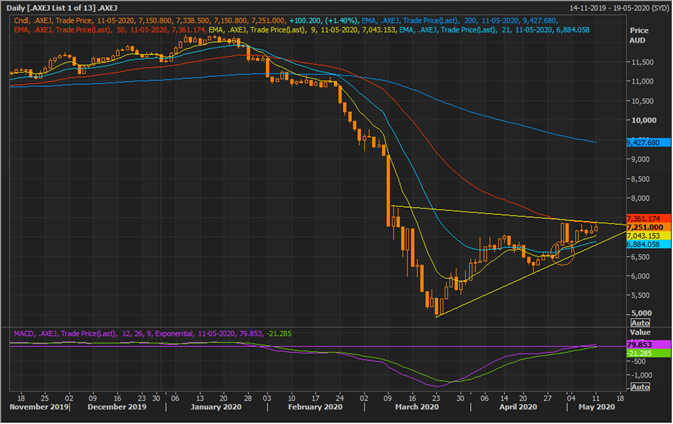
AXEJ Daily Chart (Source: EODHD/Others Thomson Reuters)
On following the daily chart, it could be seen that the index is forming a symmetrical triangle formation around the recent bottom, suggesting that the energy market is currently indecisive and is at the verge of a price move direction. This could very well depend upon how the oil scale back decided by OPEC, Russia, and the United States would pan out ahead, and also on how the market would perceive the short- to medium-term outlook for oil ahead.
To Know More, Do Read: The Oil Scale Back - A Bedrock for Balancing Demand and Supply Dynamics?
On the daily timeframe, the pair of the short-term exponential moving average (9- and 21-day) has given a positive crossover, reflecting on the short-term positive price behaviour of the index; however, while the spread between the pair of the long-term exponential moving average (50- and 200-day) is narrowing as compared to the recent past, the pair is yet to give any positive signal, suggesting that the index momentum is not entirely bullish in the medium-term.
The 12,26,9 Moving Average Convergence and Divergence Indicator or MACD indicator is giving a positive signal. Investors should monitor the index closely here to gauge the direction of ASX-listed oil stocks as a break and sustain above the symmetrical triangle might interest bulls or public participation ahead; likewise, a failure to do so would reflect the bearish market sentiment or a negative assessment of the future oil outlook by the market.
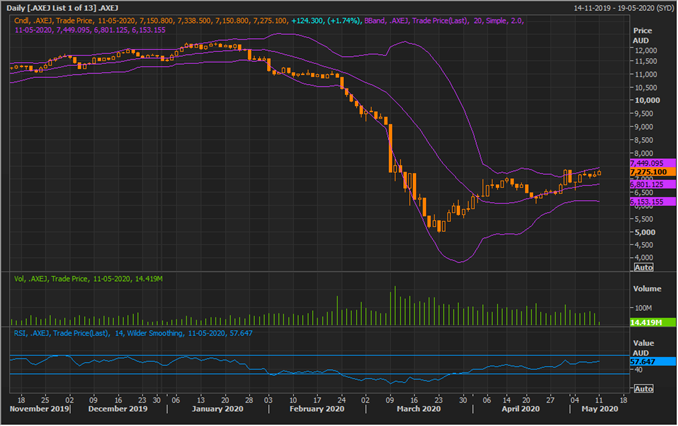
AXEJ Daily Chart (Source: EODHD/Others Thomson Reuters)
On applying the Bollinger band on the daily timeframe, it could be seen that the band is narrowing, reflecting lower volatility at present; however, it should also be noticed that the index is now testing the +1 standard deviation from the mean value, and as per the mean reversion principle of the technical analysis, prices usually retrace to the mean value post testing +-1 standard deviation of the Bollinger band.
However, there has been a lot of cases, where the market action and one-sided sentiments cause the +-1 standard deviation to expand, and one could assess the probability of any potential expansion in the +-1 standard deviation by gauging the momentum of the index, and with RSI above-mean value of the 14- suggests it is decent but would require further investigation.
- Weekly Chart
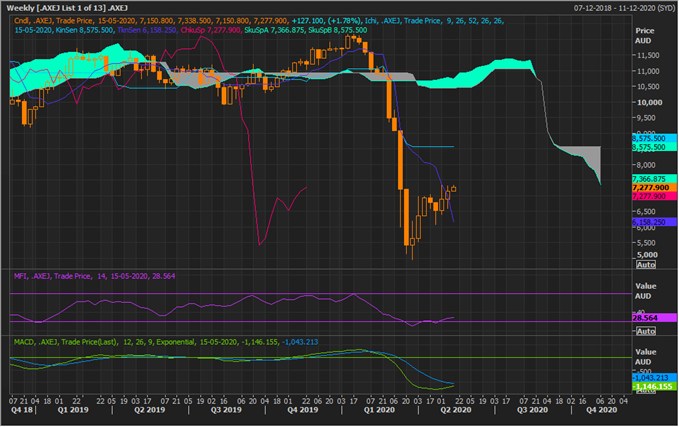
AXEJ Weekly Chart (Source: EODHD/Others Thomson Reuters)
On following the weekly chart and post applying the Ichimoku clouding technique, it could be seen that the index is currently trading below the mean value of the conversion line (mean value of 9-week high and low (dark blue)) and the base line (mean value of 26-week high and low (sky blue)), which is collectively known as Span A (7,366.87).
However, the index is trading above the conversion line, which could act as the near-term support. The spread between Span A and Span B (8,575.50) – mean value of 52-week high and low is large, suggesting that the current trend is a downtrend.
The Money Flow Index is slightly recovering while MACD lines are close to each other (Note: whether it would give a positive signal ahead or not, would depend upon the further price behaviour. Refer to the daily chart; if prices breach the symmetrical triangle to the upside, it should further improve the weekly timeframe ahead).
- Monthly Chart
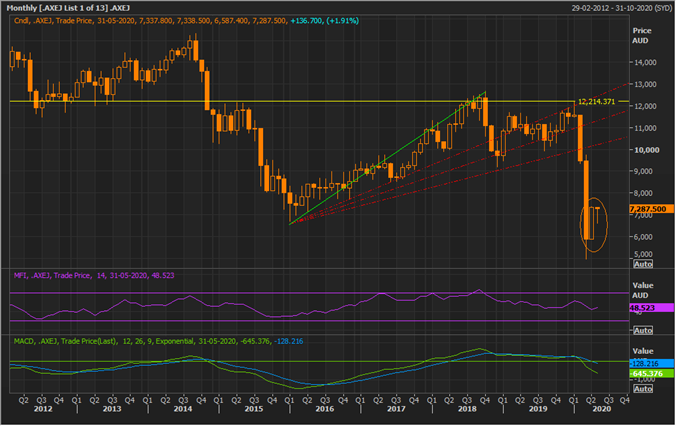
AXEJ Weekly Chart (Source: EODHD/Others Thomson Reuters)
On following the monthly chart, it could be seen that the previous few monthly candle were large down months post which the bulls have been able to stem the drawdown.
In the status quo, the current month candle, which presently resembling a bull hammer, is near the previous high, and if it crosses the previous high and sustains, it would give an early indication of a change in medium- to long-term sentiments and should be monitored closely.
On projecting the Fibonacci fan by connecting the previous low to the peak before the fall, it could be seen that the 3/3 resistance fraction of the index is also coming near the high of March candle, suggesting that the monthly frame could look bullish once the index crosses the high of that candle or the 3/3 fraction of the Fibonacci fan.
ASX-listed Oil Stocks Under Momentum
Oil Search Limited (ASX:OSH) – The stock is recovering from its recent low of $2.350 on 22 April, and is presently at $2.960, which marks a price gain of ~25.95 per cent. Also, OSH is up 3.31 per cent today against its previous close on ASX (12:36 PM AEST).
The Company has recently raised capital to support the balance sheet and cash reserve, which, as per the assessment of some local brokers, improve the overall risk profile of the explorer and producer.
To Know More, Do Read: Oil Search Shifts the Paradigm from Just Cost-Saving to Share Dilution, Completes Institutional Placement
Santos Limited (ASX:STO) – The stock gained momentum post hitting the low of $2.730 on 19 March 2020 and recovered to the present level of $4.970, which marks a price gain of ~ 82.05 per cent. Also, STO is trading 2.68 per cent higher today (12:43 PM AEST) against its previous close on ASX.
The Company recently reported a surge of 15.62 per cent in the quarterly LNG sales and revenue of $397 million (~13.10 per cent up in March 2020 quarter) from the unit.
To Know More, Do Read: Is LNG Sector Primed Against Oil Bloodbath? Santos LNG Sales Surges By 15.62 Per cent in 1QFY20
