


National Electricity Market prices are taking a hit from the reduced operational electricity demand, lower wholesale gas prices, and increased share of rooftop PV across the grid network. As per the assessment of Australian Energy Market Operator, the NEM average spot electricity prices fell to their lowest level since the last quarter of the year 2016 to stand at $66 per megawatt hour during the March 2020 quarter.
The average NEM prices across Queensland stood at $54 per megawatt hour during the same period, lowest since the third quarter of the year 2016, while the average NEM prices across South Australia stood at $65 per megawatt hour during the March 2020 quarter, lowest since the first quarter of the year 2016.
On the demand counter, AEMO assesses that the average operational demand declined by 951 megawatts during the March 2020 quarter, down by 4 per cent as compared to the previous corresponding period (or pcp) of the March 2019 quarter.
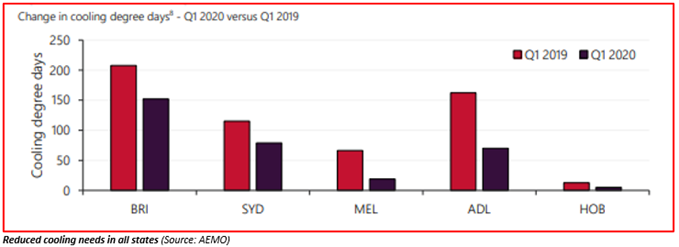
The decline in the average operational demand was mainly due to the reduced daytime cooling requirements as weather conditions remained mild in February and March across all NEM regions, and apart from that the nationwide lockdown in the mid-March also exerted pressure on demand, albeit not materially.
National Electricity Market March 2020 Quarterly Dynamics
- Weather
Weather conditions remained largely mild across NEM regions, which in turn, reduced the demand for daytime cooling across all NEM regions. As per the energy market regulator, the average maximum temperature remained below the 10-year average and well below the record average witnessed during the March 2019 quarter across all NEM regions.
Also Read: Keep Calm as Summer Is Upon Us; Summer Blackout Fears Lift Origin Shares
- Electricity Demand
The average operational demand across NEM took a hit of 951 megawatts, while the demand for rooftop PV surged by 263 megawatts. The underlying demand declined by 688 megawatts amid reduced daytime cooling needs and decline in the operational demand across all NEM regions, largely in NSW and Victoria by 492 megawatts and 217 megawatts, respectively.
To Know More, Do Read: Rooftop Solar PVs Dodge the COVID-19 Impact as New Installations Set Records
The decline in the operational demand was mainly due to the nationwide restriction placed by the Morrison Government to contain the spread of COVID-19; however, it did not considerably reduce the demand, and the main reason for the average decline in demand was mild weather conditions in February and March 2020 and increased demand from rooftop solar panels.
As per the AEMO, the average daytime rooftop PV output surged by 524 megawatts (between 0700 to 1900 hours, daytime) during the March 2020 quarter against pcp to stand at 3,023 megawatts, which in turn, further contributed to the largest operational demand decline of 1,970 megawatts.
The snippet of maximum and minimum demand across NEM regions is as below:

Maximum and minimum operational demand (MW) by region (Source: AEMO)
- The Wholesale Electricity Market
The whole electricity market remained in pressure during the first quarter of the year 2020, and wholesale electricity prices trended further downward with average prices reaching $66 per megawatt hour, which remained 49 per cent down against the average price of $130 per megawatt hour in the first quarter of the year 2019 (or pcp).
While prices across Queensland and South Australia declined due to lower demand, Tasmania also witnessed a decline with average wholesale electricity prices reaching $45 per megawatt hour mainly due to the lower price offered by the hydro generation in the region.

The decline in wholesale prices was due to the lower gas prices, reduced demand, shift in offers from black-coal fired and hydro generation, and due to the increased output from wind and solar.
Energy Futures Market
The price of energy futures declined during the March 2020 quarter with Cal21 (contract for CY2021) ending the period at multi-year lows across all regions amid lower spot electricity, lower gas prices, and expectations of further increases in renewables, rooftop PV, and demand concerns amidst COVID-19 outbreak.
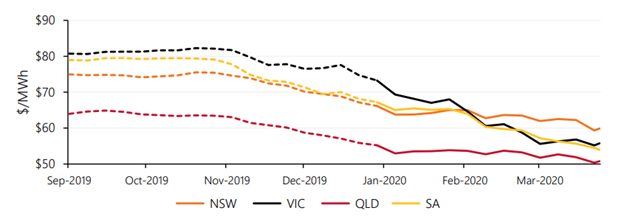
ASX Energy – Cal21 swap prices by region – seven day averages (Source: AEMO)
Furthermore, by region, Victoria witnessed the largest decline in Cal21 swap with prices falling by $17 per megawatt hours to stand at $56 per megawatt hour during the quarter, while Cal22 declining by $15 per megawatt hour to stand at $51.50 per megawatt hour.
In Mid-March, the futures market also demonstrated the impact of COVID-19 with the largest decline in futures of Q2 and Q3 2020, which declined by 11 per cent in March 2020 (from 13 to 31 March).
The Electricity Generation Share
During the quarter, the black coal and gas remained the largest source of electricity generation; however, the generation from black coal declined by 1,106 megawatts against pcp to stand at an average of 12,024 megawatts, which marked the lowest level since the first quarter of the year 2015.
The decline in the black coal generation was mainly due to the higher number of outages in February and March 2020, reduced operational demand, and displacement caused by the renewable front.
Grid-scale VRE or variable renewable energy surged by 551 megawatts during the period, while hydro rebounded from low levels witnessed during the first quarter of the year 2019 to mark an increase of 208 megawatts.
The Gas Powered Generation (or GPG) across NEM regions plunged by 566 megawatts during the period amid a decline in the operational demand and increased VRE output in the southern regions.
The GPG generation declined by 266 megawatts across South Australia, 148 megawatts across Victoria, and 22 megawatts across Queensland.
Also Read: Morrison Government Delivers on the Election Promise; Backs Two Gas-Powered Generators
Tasmania and NSW witnessed a decent increase in the hydro generation with total contribution increasing by 208 megawatts, despite lower spot electricity prices and demand due to a material reduction in the price of hydro offered in the wake of a decline in gas prices, increased rainfall, and lower electricity spot prices.
On the solar and wind counter, the average grid-scale VRE generation stood at 2,667 megawatts during the period, up by 551 megawatts against pcp, but down against the previous quarter amid reduced capacity factors.
The increase in VRE generation was mainly due to the ramping up of recently installed capacity and minor addition from new projects.
However, while the grid-scale solar output surged by 263 megawatts against pcp during the March 2020 quarter amid increased installed capacity, the ~ 6 per cent decline in solar irradiation indemnified the increase.
To Know More, Do Read: The Future of Energy Generation in Australia; Solar to Increase Three-Fold By 2024
To summarise, the NEM market remained largely in pressure during the March 2020 with average spot electricity prices fell to their lowest level since the last quarter of the year 2016 to stand at $66 per megawatt hour during March 2020 quarter in the wake of lower operational demand, mild weather conditions, lower gas prices, a decline in wholesale electricity prices, and increase installation of Solar PVs.
The electricity demand took a hit of 951 megawatts during the quarter while underlying demand declining by 688 megawatts amid reduced daytime cooling needs and decline in the operational demand across all NEM regions.
The Energy futures market also took a hit with CY2021 swap or Cal21 ending the period at multi-year lows across all regions amid lower spot electricity, lower gas prices, and expectations of further increases in renewables.
