


We will be covering the recent updates of two diversified stocks with the latest operational activities of these two businesses; one from the Investment Management Company and another from the mining and resource company.
Cromwell Property Group (ASX: CMW)
Cromwell Property Group operates as a Real Estate Investment Trust having international investors and operations in 3 continents. On 17 January 2020, the company reported the extension of its ongoing buy-back program of securities till 15 January 2021.
Extending buy-back program is important for the Company, as it intends to maintain the highest amount of flexibility for the capital management strategies and to increase the shareholders’ value. The company will fund buy-back, mostly through its cash reserves or an asset sale, whereas it’s not likely to borrow from external sources in order to fulfil the buy-back option. The company can buy upto a maximum number of 222,709,082 of stapled security.
FY19 Operational Highlights for the Period ended 30 June 2019: CMW announced its full-year results, wherein the company reported statutory profit at $159.9 million as compared to $204.1 million in FY18, down by 21.7% on y-o-y basis. Operating profit is recorded at $174.2 million, depicting a growth of 11.1% on y-o-y basis. Total Funds and Asset management segment profit came in at $28.5 million as compared to $35.0 million in FY18. The quarter witnessed an increase of AUM at 3.2% to $9 billion driven by an increase in retail AUM to $2.3 billion as compared to $2 billion in FY18. The company reported wholesale AUM unchanged at $6.7 billion. FUM within the Europe segment remain steady at €3.8 billion, while the company believes it has underpinned the half of the expected growth. Post completion of recent CEREIT acquisitions and successful acquisition of investor interests in Cromwell Polish Retail Fund this will increase to 64% on y-o-y basis.
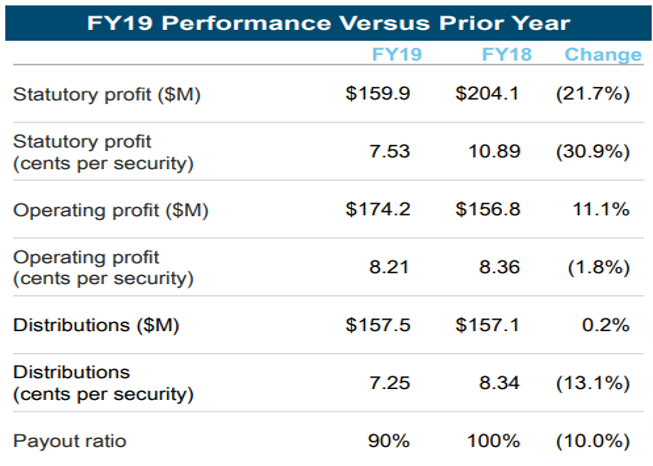
FY19 Operational Highlights (Source: Company Reports)
Guidance: As per the management guidance, the business expects slowdown in business prospects on account of macro slow down for coming years. FY20 operating profit affirmed at no less than 8.30 cps and distribution guidance affirmed at no less than 7.50 cps which represents an operating profit yield of 6.7% and a distribution yield of 6.0% respectively.
Stock Update: The stock of CMW is quoting at $1.210 with a market capitalization of $3.17 billion. The stock is quoting at the upper band of its 52-week trading range of $0.987 to $1.345. The stock has generated mixed return of -6.90 % and 3.85% in the last three months and six months, respectively. The stock is available at a price to earnings multiple of 16.140x on its trailing twelve months (TTM) basis. The stock has generated an annualized dividend yield of 6.07%.
Westgold Resources Limited (ASX: WGX)
Westgold Resources Limited is engaged in the development, exploration and operating of Gold Mines across Western Australia. Recently, the company informed its successful interception of an assertive more than down-plunge step-out hole from the lowest production levels at Great Fingall with extraordinary results.
Operating Highlights for the Quarter ended 30 September 2019: WGX declared its first quarter FY20 results, wherein the company reported Group gold output at 57,472 ounces at a Cash cost (C1) of A$1,173/oz and an AISC of A$1,410/oz. Meekatharra Gold Operations (MGO) output came to expected levels with the newly appointed secondary crusher resulted in growing plant output and concealed head grades recovering from the reduction effects undergone in the previous quarter. The company reported cash & bullion at $70.8 million. The company reported its gold hedge position during Q1FY20 at 202,500 ounces with a realization of A$1,879/oz. The group reported operating cash flow of $25.3 million from its Group gold operations across the mining segment. During the quarter, pre-pay debt across Gold decreased 3,750 ounces to 11,250 ounces with ~$6.1 million amortizing/ repaid over the quarter. During the period Mt Marion Lithium Royalty of $13 million remained pending.
Segment Results:
Fortnum Gold Operations (FGO) reported production of 13,764 ounces during Q1FY20, declined 3% from the previous quarter of 14,222 ounces while the business reported earlier quarterly guidance a decline of 14%. The company reported better than expected fiscal outcomes wherein, it has improved its cash costs by 11% and a mid-range guidance at A$1,139/oz and a 6% beat of AISC at A$1,410/oz.
Meekatharra Gold Operations (MGO) delivered a production of 25,958 ounces of gold for Q1FY20, witnessed an increase of 12% on y-o-y basis at 22,233 ounces at Q1FY19. Gold output, during the quarter stood in-line with guidance and informed from a 17% increase in plant quantity.
Cue Gold Operations (CGO) reported quarterly production of 17,750 ounces of gold during Q1FY20, reported a decline of 15% from 20,914 ounces in Q1FY19 and dropping outside of physical guidance by 15%. WGX was negatively impacted by the deferral in development in the ore tonnes resulting from the late introduction of ore driving at Big Bell. While, mine output and grade from the Comet mine were unexpectedly lower than the expected results during the quarter. The business reported decline in the overall underground head grade by 9% on y-o-y basis.
The company reported, fiscal output as All-in Sustaining Costs (AISC) against guidance for the second quarter and FY20 is charted below on an operation and group basis: The company estimates Annual ASIC at around $ $1,370/oz to $1,420/oz while Q2 guidance for ASIC expected at $1,410/oz to $1,460/oz.
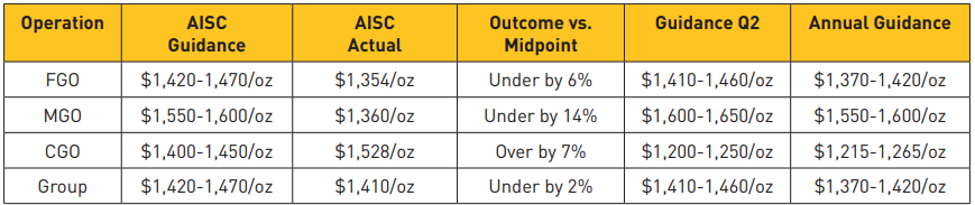
FY20 Operational Guidance: (Source: Company Reports)
The group expects annual guidance from FGO operations at $1,370/oz to $1,420/oz for FY20 while MGO segment is expected to deliver an ASIC of $1,550/oz to $1,600/oz. The group expects FY20 ASIC from CGO business at $1,215 oz to 1,265/oz.
Stock update: The stock of WGX is trading at $2.310 with a market capitalization of $927.23 million. The 52-week low and high of the stock stands at $0.885 to $2.570 and currently, the stock is trading at the upper band of its 52 week trading range. The stock has delivered positive returns of 8.41% and 15.42% in the last three months and six-months, respectively.
