


Pilbara Minerals Limited (ASX: PLS), a lithium hydroxide developer and lithium extractor and the operator of high-lithium Pilgangoora Project took a jab over fall in lithium chemical pricing.
The share prices of the company are in continuous downtrend from the level of A$1.245 (Dayâs high on 10th January 2018).
The shares dropped from A$1.245 to the level of A$0.570 (Dayâs low on 24th December 2018).
 PLS Daily Chart (Source: Thomson Reuters)
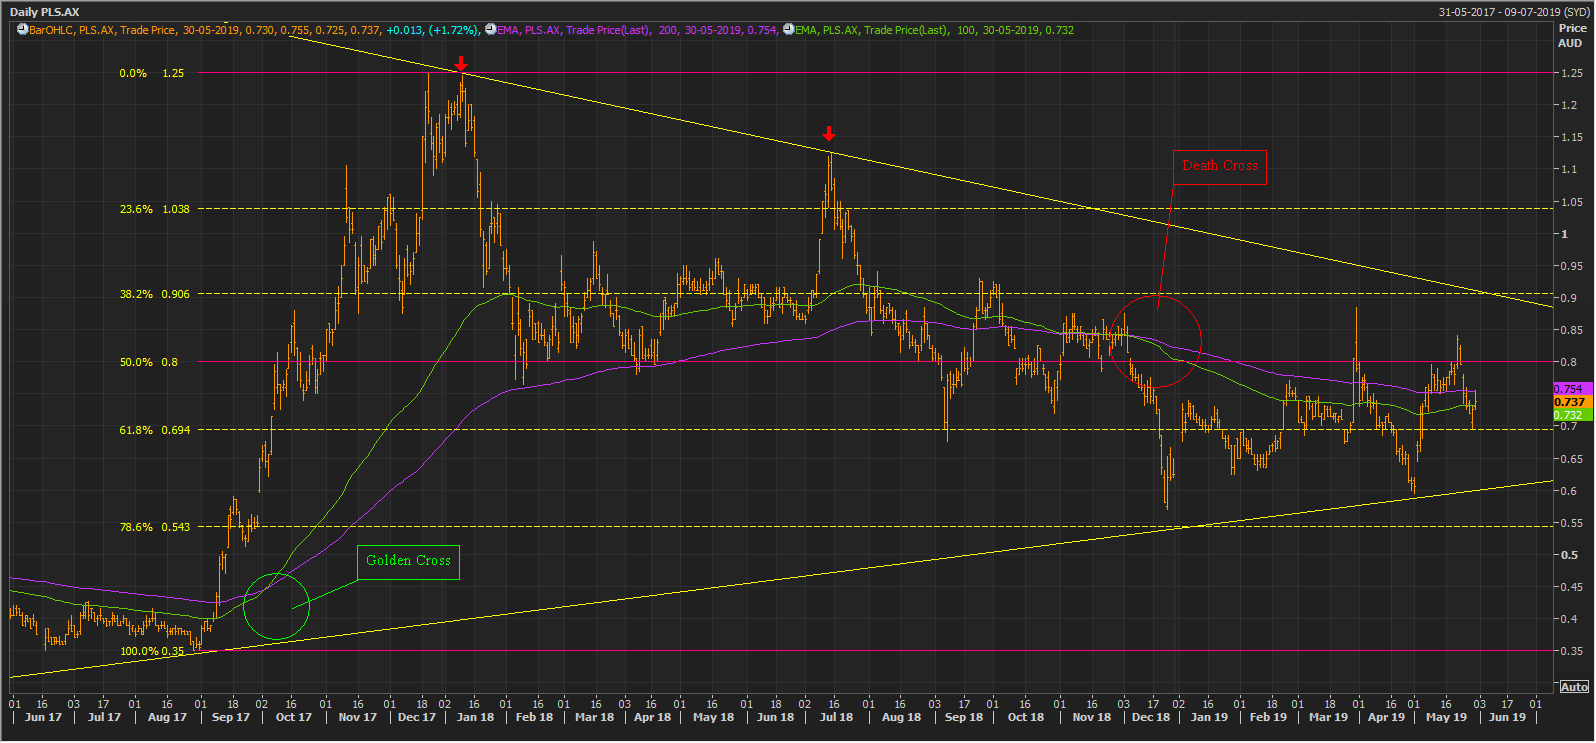
On the daily price chart, we can see that the share prices of the company moved in a continuous downtrend from the level of A$1.245. Before reaching the top of A$1.245, the share prices rose steeply from the level of approx. A$0.35.
The price actions during the rising of the shares from the level of A$0.35 to the level of A$1.245 marked Golden Cross-over (Bullish Signal) of 100 and 200-day exponential moving averages.
On a daily chart, a Death Cross-over (Bearish Signal) had also emerged, cross of 100 and 200-days exponential moving average. However, the shares prices of the company had corrected by almost 78.6% of the initial rally from A$0.35 to A$1.245 and took the support near the 78% Fibonacci retracement zone.
 PLS Daily Chart on a quarterly timeframe (Source: Thomson Reuters)
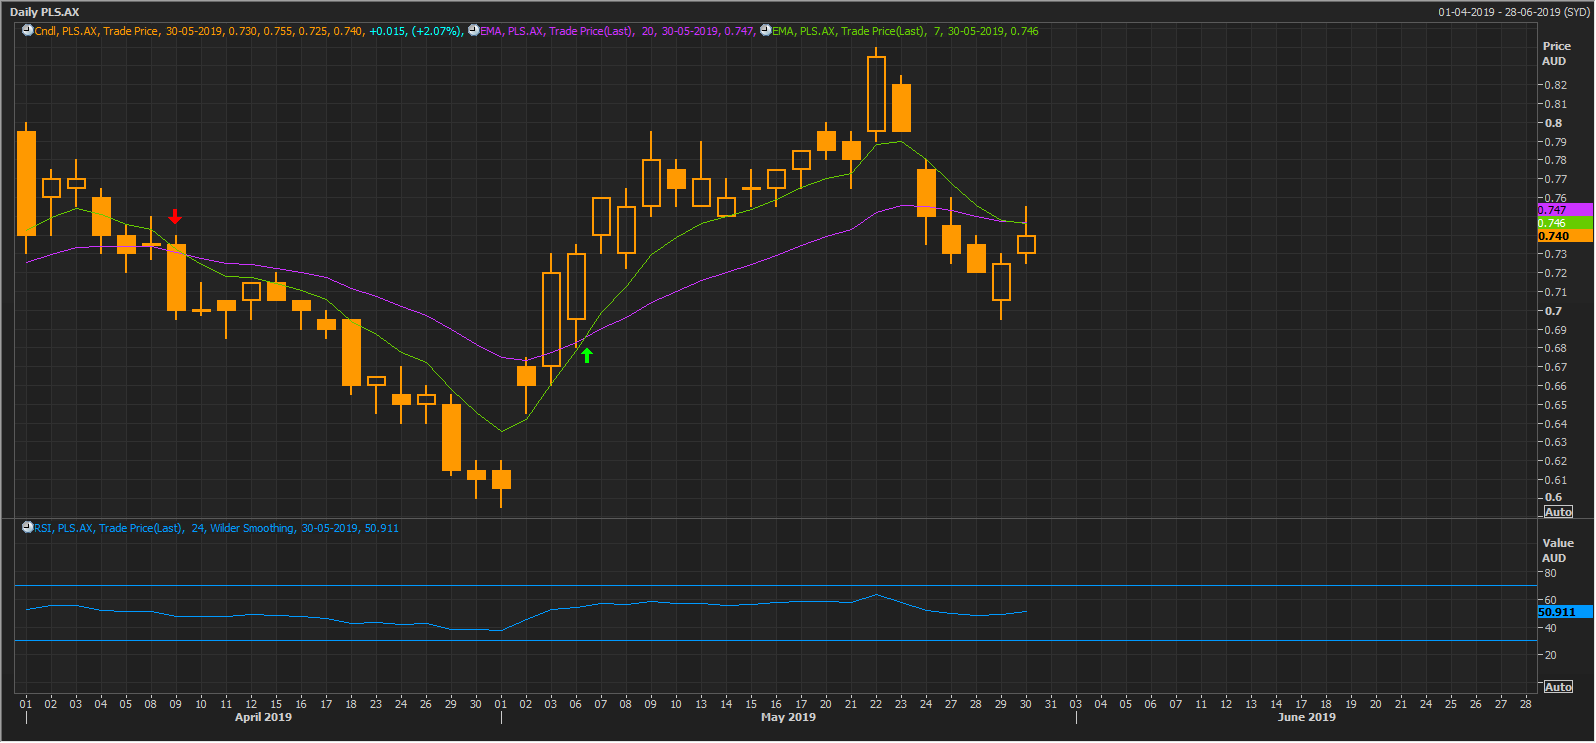
Analysing the daily price chart of the past two months trading data, we notice that, post the price drop in April 2019, the share prices of the company have shown promising recovery, with a positive cross of short-term 7 and 20-days exponential moving average.
 PLS Daily Chart on a quarterly timeframe (Source: Thomson Reuters)
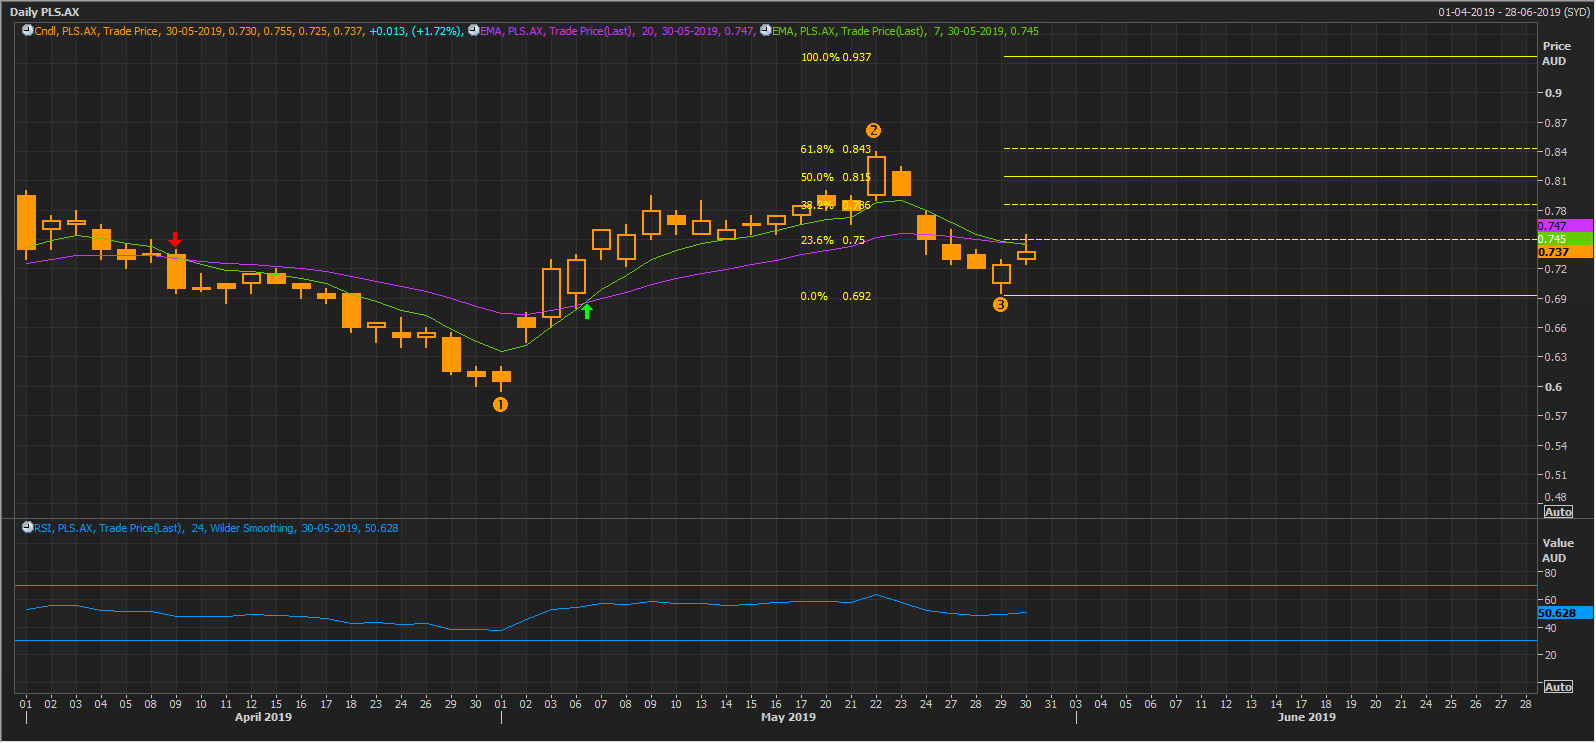
The recovery in the share prices from the level marked as (1) and retracement from the level marked as (2) gave us perfect points to connect Fibonacci Series with the recent low marked as (3).
The results of Fibonacci Projections are as 23.6%(A$0.75), 38.2%(A$0.786), 50.0% (A$0.815), 61.8% (A$0.843), and 100% (A$0.937).
Iluka Resources Limited
Iluka Resources Limited (ASX: ILU), an Australian Securities Exchange listed Zircon producer and rutile provider, which reported a 22% growth in mineral sand revenue for FY19, is showing recovery on the price charts.
The share price of the company dropped from the level of A$12.200 (Dayâs high on 14th May 2018) to the level of A$7.220 (Dayâs close on 24th December 2018).
After initially dropping to the level of A$7.220, the share prices of the company improved, and the prices are currently at A$9.740 (Dayâs close on 31st May 2019). The shares posted a first month increase in May 2019 after losing value for the last two-months on ASX.
 ILU Daily Chart (Source: Thomson Reuters)
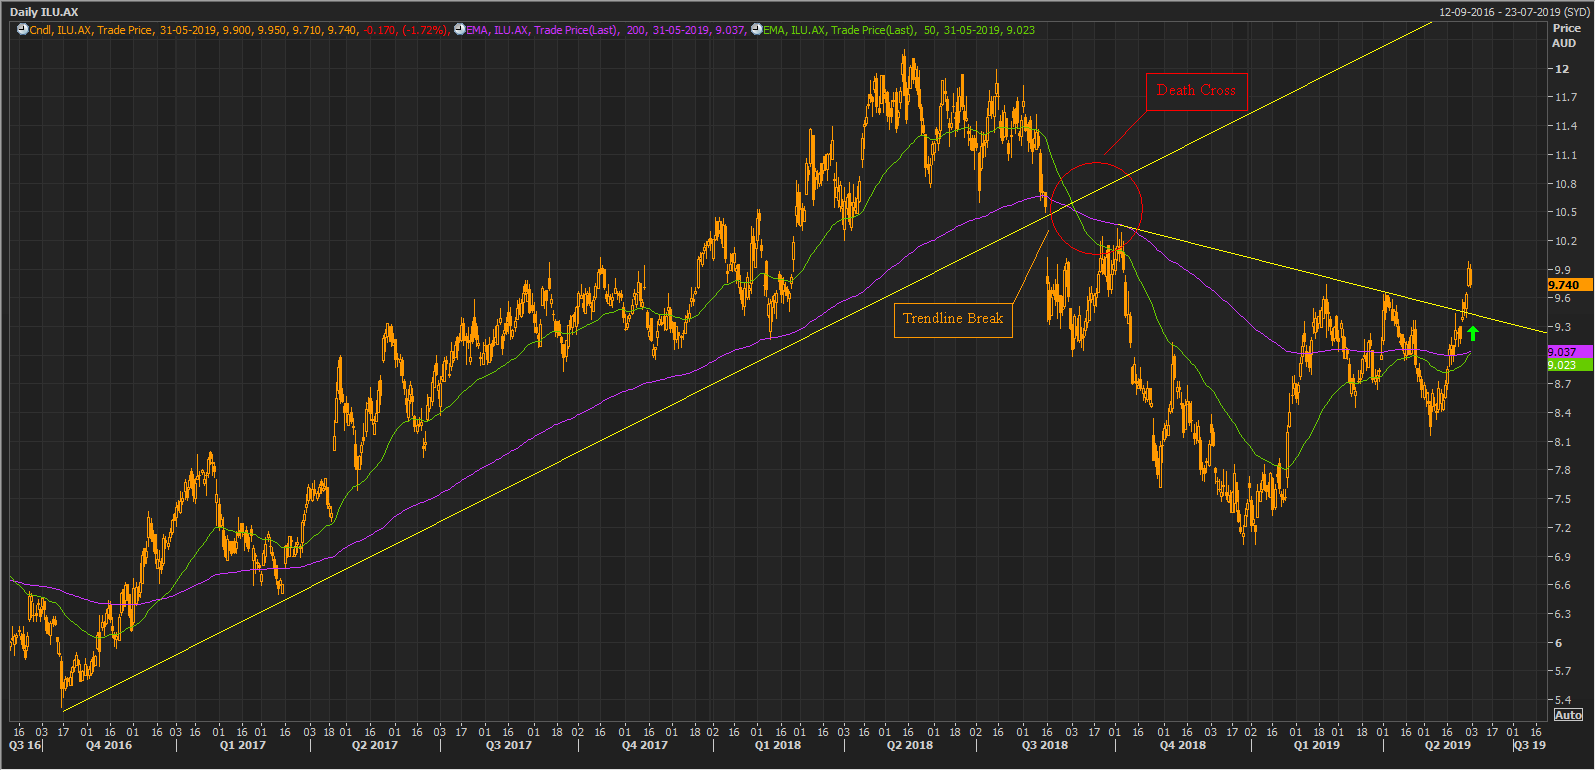
As can be seen on the daily chart, the share prices of the company moved in an uptrend since the third quarter of the year 2016. The prices surged to the level of A$12.200 and fell sharply to break the upward sloping trendline with a gap down opening on 16th September 2018.
The gap down opening further marked a Death Cross-over (bearish signal) of 50 and 100-days exponential moving averages (red circle), and the share prices dropped to the level of A$7.020.
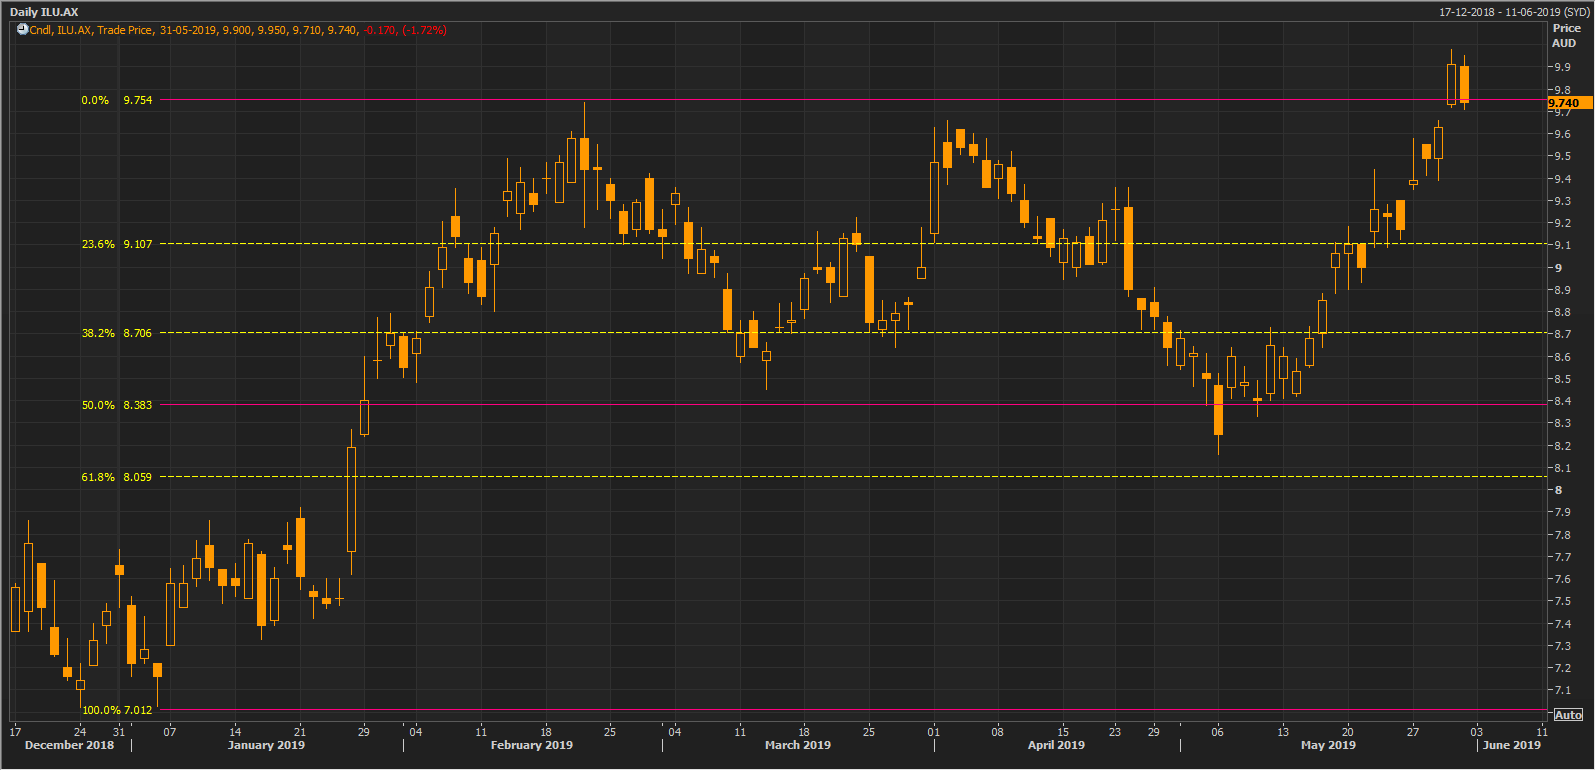 ILU Daily Chart (Source: Thomson Reuters)
Post dropping to the level of A$7.020, the share prices rose to the level of A$9.740 (Dayâs high on 21st February 2019). After inching up from A$7.020 to A$9.740, the shares took a correction of almost 61.8%, which is usually considered as a good buying zone by technical analysts. The prices recovered from 61.8% zone and rose significantly to the present level of A$9.740.
Disclaimer
This website is a service of Kalkine Media Pty. Ltd. A.C.N. 629 651 672. The website has been prepared for informational purposes only and is not intended to be used as a complete source of information on any particular company. Kalkine Media does not in any way endorse or recommend individuals, products or services that may be discussed on this site. Our publications are NOT a solicitation or recommendation to buy, sell or hold. We are neither licensed nor qualified to provide investment advice.
