


Coles Group Limited (ASX: COL)
Coles Group is one of the major retail chains in Australia and is engaged in the selling of consumer goods like fresh food, liquor etc. On 19th February 2019, the company posted its half year results ended December 2018. However, the street didnât get impressed by the numbers, and the stock plunged drastically by almost 9% on two consecutive days. Eventually making its lowest low on the third day, it tried to recover. The selling was intense from the upper levels but not strong enough to drag the stock to lower lows. The buying coming in from lower levels supported the stock. This fight between the bulls and bears made the stock to go nowhere for almost a month and It remained in a tight range around A$11.34. However, on 20th March 2019, the stock had shown a good momentum on the upside and managed to give the highest closing after the plunge. The stock closed at A$11.66 which is a bullish signal as the closing price is achieved after taking all the news and information in the account by investors for the entire trading session. A clear bullish view has been established from here, and the stock may touch the resistance around A$12.10. To further confirm the trend, a very popular trend following indicator MACD has already given a positive crossover (buy signal) on the daily chart stating the trend on the upside has been started. The stock last closed at A$11.68, as at March 22, 2019.
Metcash Limited (ASX: MTS)
Metcash is a wholesale marketing and distribution company dealing in consumer staples. The stock has been rising continuously from the past few months. This consistent uptrend started soon after the price made its 52 week low of A$2.25 on 18th December 2018. The stock entered the oversold zone according to Relative Strength Index (RSI) which displayed a reading of 23.79 on daily chart which is well below the 30 mark. This was the indication that soon the stock may reverse from the bottom level. The very next day the formation of a bullish engulfing candlestick pattern was seen on the daily chart. Bullish engulfing candlestick pattern is a bullish reversal pattern which is formed with a specific formation of two consecutive candles. The first candle is red/black (closing is lower than the opening) and the second candle should be green/white (closing should be greater than the opening). Additionally, the second candle must engulf the entire real body of the first candle. In simple words, the opening of the second candle should be equal or lower than the previous candleâs closing and the closing of the second candle should be equal or higher than the closing of the previous candle. This pattern marks the bullish reversal of a downtrend and therefore has a higher significance when forms at the lower levels. Soon after this candlestick pattern the prices consistently rallied in one way and touched a high of A$2.8 on 5th March 2019. As of now (22th March 2019) the stock was trading around A$2.61 and has a support below A$2.5 which is to be watched out for any breach in the near future. In a nutshell, the stock has been up 8.75% in last three months and it dropped by 1.14% in last five days.
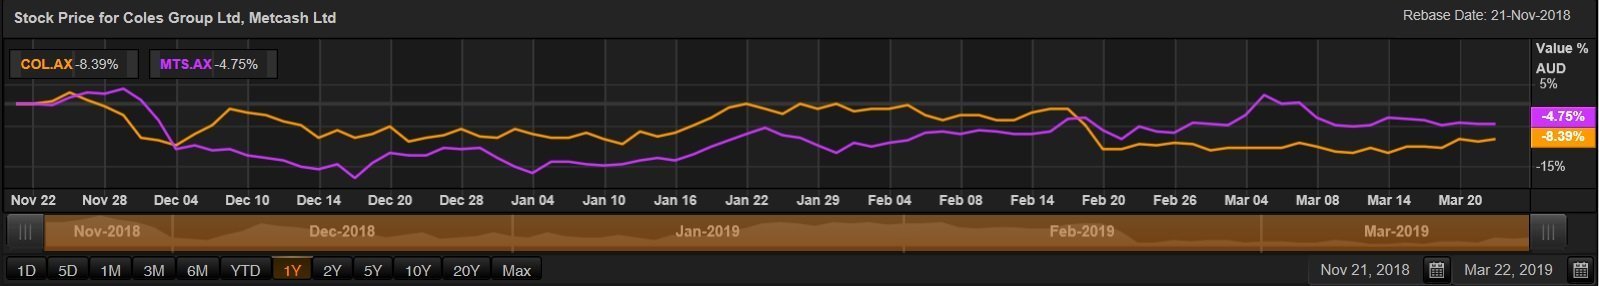 Comparative Price Chart (Source: Thomson Reuters)
Disclaimer
This website is a service of Kalkine Media Pty. Ltd. A.C.N. 629 651 672. The website has been prepared for informational purposes only and is not intended to be used as a complete source of information on any particular company. Kalkine Media does not in any way endorse or recommend individuals, products or services that may be discussed on this site. Our publications are NOT a solicitation or recommendation to buy, sell or hold. We are neither licensed nor qualified to provide investment advice.
