


The S&P/ASX 200 Resource sector index has soared by ~11.86% from last six months lowest dip at AUD 4467.437 on 26th August to reaching its peak of AUD 4997.255 on 17th December 2019. Subsequently, the benchmark slipped settling at AUD 4945.285 on 24th December 2019.
In the milieu of this, it is quintessential to know the resource stocks which are performing well or maybe useful for a near-term equity investment decision as presented in the following section.
Caltex Australia Limited (ASX:CTX)
Caltex Australia is the largest and only Australian company operating in transport fuels and convenience retail sector with capability and scale across states and territories. The Company imports, refines and distributes fuels and lubricants to meet one-third of the country’s transport needs. It has around 800 Caltex-controlled sites to deliver fuel and lubricants with ~ 55 Foodary sites, serving ~3 million consumers and ~70,000 business customer every week.
The share price has increased by ~41.56% from last six months; lowest dip at AUD 23.79 on 28th August to AUD 34.76 on 2nd December 2019. The rise in share price accompanied the announcement related to increasing in Caltex Refiner Margin (CRM) from the previous quarter to USD 10.53/bbl in Q3 2019, Moody’s rating long-term corporate credit as Baa1 with a stable outlook and the proposal of IPO for 49% interest in 250 crore freehold sites to mention few.
Caltex share performance:
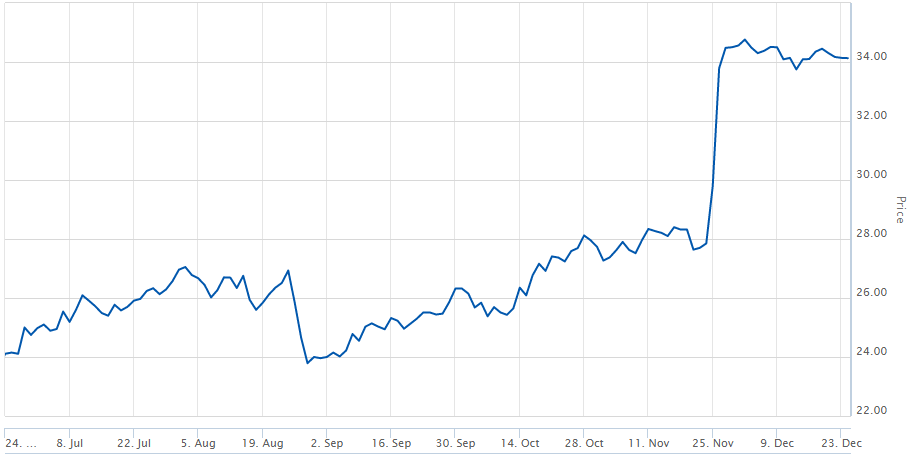
Source: Australian Stock Exchange
Caltex has exchanged contracts for ~$80 million to divest the first tranche of 25 HBU (higher and better use) sites for total proceeds of ~$136 million. It is expected that $120 million of sale proceeds will be received this calendar year, with the remaining in early 2020.
And, the second tranche divestment of ~25 sites expected to commence early next year. It has also intended to raise between $300m and $500m through AUD denominated hybrid capital securities, as part of its ongoing capital management strategy.
With above actions, it is anticipated to have NPAT around $320 million to $360 million with a replacement cost of sales operating profit (RCOP) and RCOP EBIT outlook as $580 million to $620 million in FY19.
The company has annual Dividend Yield of 2.72 with P/E ratio of 26.51x and EPS of AUD 1.288. During FY18, EBIT ROCE was 19.0% and full-year dividends as 118 cents per share. Its 52 weeks high and 52 weeks low stand at AUD 35.160 and AUD 20.520, respectively, and has a market cap of AUD 8.52 billion.
CTX closed the day’s trade session at AUD 34.160, up 0.09% on 27 December 2019.
New Hope Corporation Limited (ASX: NHC)
Diversified energy player, NHC has primary operations involving exploration, coal mining, port operations, oil, agriculture, advanced technologies and investment.
Currently, the company has three open-cut operational mine producing thermal coal, i.e. New Acland Mine, Bengalla and Jeebropilly Mine situated at the north of Oakey on the Darling Downs – Queensland (QLD), Hunter Valley of New South Wales (NSW) and West Moreton region near Ipswich – QLD respectively.
The stock witnessed the lowest dip at AUD 2.11 on 19th August to AUD 2.55 on 12th September 2019. The stock momentum was perhaps driven by the Queensland court judgement in favour to the New Ackland Stage 3 projects. However, this does not seem able to hold share price constant which started to tumble due to the plunge in coal price, as shown below.
NHC share performance:
Source: Australian Stock Exchange
The Company’s 2019 last quarter report showed an increase in Saleable Coal production than the previous year’s corresponding quarter. Operations at QLD region (100% owned) increased by 5% from the previous year to 1.18 Mt and NSW region (80% owned) increased by 145% from the previous year to 2.148 Mt.
The company has annual Dividend Yield of 8.13% with P/E ratio of 8.250x and EPS of AUD 0.253.
EBITDA from current operations during FY19 was $517.061 million with the dividend declared as 9.0 cents per share. The total asset value for QLD and NSW regions is $521 million and $1747 million as of FY19.
The stock’s 52 weeks high and 52 weeks low stand at AUD 4.5 and AUD 1.99, respectively, and has a market cap of AUD 1.74 billion.
NHC closed the day’s trade session at AUD 2.130, up 1.91% on 27 December 2019.
Independence Group NL (ASX:IGO)
Independence Group is an exploration and mining company with high-quality assets, owning 100% of Nova nickel-copper-cobalt operation and 30% of Tropicana Gold Mine. The Nova operation is in the Fraser Range while Tropicana located on the western edge of the Great Victoria Desert.
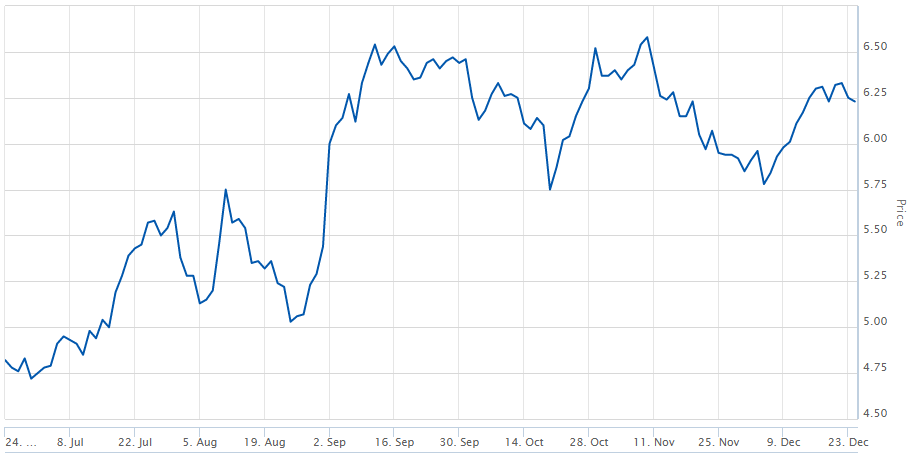
The share price has increased by ~29.25% from last six months; lowest dip at AUD 4.72 on 28th June to AUD 6.58 on 8th November 2019. During the period, continuous ripples in share price are noticed due to the higher operational cost than the guidance and increasingly record production from both of its operations.
IGO share performance:
 Source: Australian Stock Exchange
The company has FY20 production guidance as Ni – 27 to 30 kilotonnes, Cu – 11 to 12.5 kilotonnes and Co – 850 to 950 tonnes for Nova operations with cash cost as $2.00 to A$2.50/lb of Ni. Tropicana expected to produce gold in the range of 450koz to 500koz with cash cost in the range of $700/oz - $780/oz Au in FY20.
The company has annual Dividend Yield of 1.6% with P/E ratio of 48.33x and EPS of AUD 0.129.
EBITDA from continuing operations during FY19 was $341 million with the dividend declared as 4.0 cents per share and $3.13 net tangible assets per share. Its 52 weeks high and 52 weeks low stand at AUD 6.65 and AUD 3.61, respectively, and has a market cap of AUD 3.68 billion.
IGO closed the day’s trade session at AUD 6.530, up 4.82% on 27 December 2019.
Panoramic Resources Limited (ASX:PAN)
Panoramic Resources is an exploration and mining company developing Savannah Nickel Project (East Kimberley region, WA). The project has a life of mine of ~8.3 years with resources of 218.3 kilotonnes of Ni, 99.1 kilotonnes of Cu and 14.9 kilotonnes of Co.
The share price has increased by ~42.6% from last six months; lowest dip at AUD 0.269 on 5th July to AUD 0.43 on 6th November 2019. The share price plummeted perhaps due to the poor performance during the September quarter whereas later improved with $312 million hostile takeover by the Independence Group.
PAN share performance:
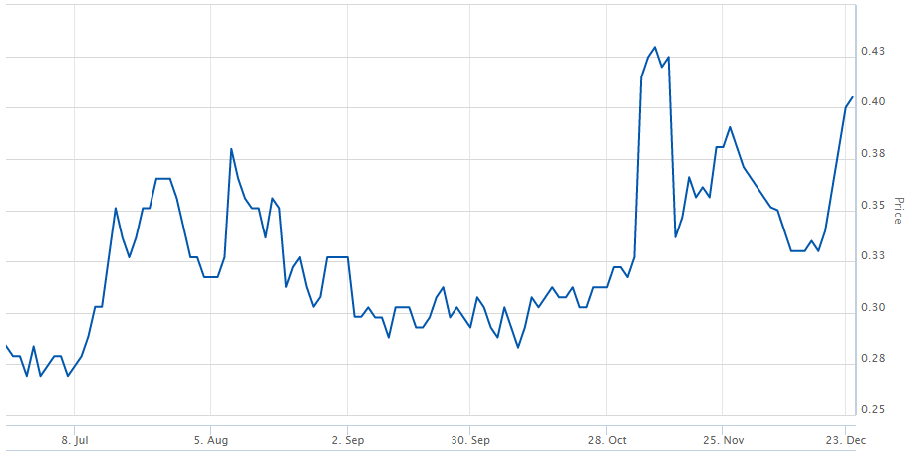
Source: Australian Stock Exchange
During September quarter 2019, nickel production was down in comparison to the previous year quarter by 12% to 1.342 kilotonnes. Whereas copper increased by 5% to 855 tonnes, and cobalt production was 64 tonnes in concentrate.
The last dividend noticed in FY15 as 1 cent per share and since then no dividend has been distributed. EBITDA from continuing operations during FY19 was negative $604K, though improvement realized in EBITDA from the previous year, i.e. negative $ 8,155 K.
Its 52 weeks high and 52 weeks low stand at AUD 0.481 and AUD 0.265, respectively, and has P/E ratio of 20.25x, EPS of AUD 0.02 with a market cap of AUD 270.22 million.
PAN closed the day’s trade session at AUD 6.530, up 4.82% on 27 December 2019.
Disclaimer
This website is a service of Kalkine Media Pty. Ltd. A.C.N. 629 651 672. The website has been prepared for informational purposes only and is not intended to be used as a complete source of information on any particular company. Kalkine Media does not in any way endorse or recommend individuals, products or services that may be discussed on this site. Our publications are NOT a solicitation or recommendation to buy, sell or hold. We are neither licensed nor qualified to provide investment advice.
