


Due to the expansion of business prospects across different geographic regions, there has been a surge in the bottom-line of several small businesses. These businesses are witnessing profitability growth on account of new business horizons and changing macro factors. Due to the strong bottom-line growth, the businesses have been able to deliver healthy dividends to the investors. Due to the emergence of online marketing and higher retail consumption, which is leading to brand awareness among the consumers, these businesses have delivered margin-expansion in the recent past. We will be discussing two diversified companies within the small cap and mid-cap space with decent growth prospects. On many occasions, investors could find value in small market capitalization companies depending upon the business model and management track record of these companies.
Navigator Global Investments Limited (ASX: NGI)
Navigator Global Investments Limited is a parent of US based investment manager Lighthouse Investment Partners, LLC. Lighthouse offers several diversified financial solutions to the customers.
H1FY20 Operational Highlights for the Period ended 31 December 2019: NGI announced its half-yearly results, wherein the company reported total revenue of US$53.811 million, depicting a fall of 8% on pcp terms. EBITDA at US$19.235 million, as compared to US$20.125 million in H1FY19. The company reported 8% decline in the profit before income tax of US$17.988 million, depicting a decrease of 8%. Net profit of the company degrow by 8% on y-o-y basis at US$13.487 million. The company posted its AUM at US$13.4 billion as on 31 December 2019, declined from US$14.2 billion in H2FY19. The company reported its management fees at US$46.6 million, decline from US$54.8 million in H1FY19. There has been a $0.5 million decrease in information and technology expenses compared to the prior half year as a result of decreased costs for the MAS business. Performance fees for the period stood at US$3.7 million, up of US$3.4 million from previous corresponding period. The increase in performance fees was aided by the positive investment performance achieved within the portfolios relative to the same period in the prior year.
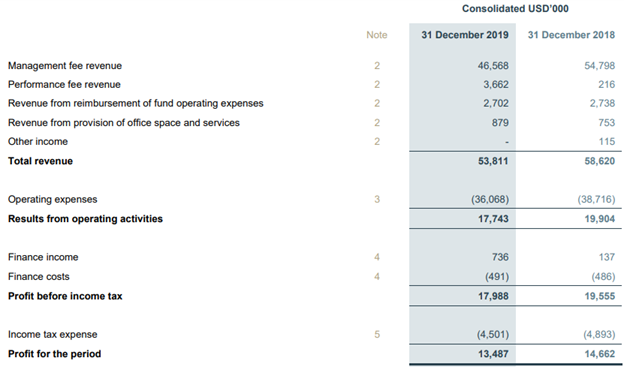
Key H1FY20 Income Statement Highlights (Source: Company’s Reports)
Balance Sheet Highlights: The company reported total current assets of US$58.239 million, which includes cash balance of US$35.094 million and trade receivables of US$23.136 million. Total assets as on 31 December 2019, stood at US$241.98 million which includes investments recognised at fair value of US$18.368 million, intangible assets of US$95.407 million, deferred tax of US$48.282 million. Plant and equipment were reported at US$5.961 million, while other non-current assets stood at US$2.483 million as on 31 December 2019. On the current liability side, the company reported its trade and other payables at US$2.436 million, lease liabilities of US$1.862 million and employee benefits of US$9.549 million. Net assets were reported at US$212.478 million as on 31 December 2019.
Going forward, the company will be focusing on the following business strategies.
Will focus on constantly providing investment performance sync with the investment schemes of the relevant funds and portfolios.
The company will further focus on expanding the global distribution reach through creating new relationships and leveraging the existing relationships across the globe.
The business will be focusing on delivering a high level of service to the clients from every Geographies of the business, with quality and timely reporting on their investments and a preemptive approach to ensuring to meet all their investment needs.
Last but not the least, the company will be continuing to emphasis on providing specialized services to the prospective customers.
Dividend Announcement: The Board of Directors has declared an unfranked dividend of US$0.085 per ordinary share with a payment date of 6th March 2020.
Guidance: As per the Management guidance, the company expects EBITDA at ~US$33.5 million. However, with the inclusion of performance fees, the company expects full year EBITDA within the range of US$34 million to US$36 million for FY20.
Stock Update: The stock of NGI closed at $3.52 with a market capitalization of $541.57 million on 14 February 2020. The stock is available at a price to earnings multiple of 15.53x. At current market price, the stock has generated a dividend yield of 7.36%. The stock has generated a positive return of 20.14% and 36.96% in the one month and three months, respectively. The 52 weeks high and low of the stock stood at $4.250 and $2.290.
Freedom Foods Group Limited (ASX: FNP)
Freedom Foods Group Limited is engaged in sourcing, processing, selling, marketing, and distribution of specialty cereal and snacks and plant and dairy beverages. The selling, marketing and distribution of canned specialty seafood. Investment in large scale dairy farming operations. Recently, the company clarifies its dispute with Blue Diamond Growers (Blue Diamond), which states all payments of the past shipments has already been cleared. There has been no disruption to supply of Blue Diamond almond paste.
Key FY19 Operational Highlights for year ended at 30 June 2019: FNP declared its full year results, wherein the company reported net sales revenue of $476.2 million, depicting an increase of 34.9% on y-o-y basis, aided by strong growth in export markets, with China sales revenues growing by 37.3%. The year was marked by successful launch of more than 130 new product formats across retail, grocery, out of home and export markets segments and supported by increased marketing expenditure as investment for future growth. The year witnessed exceptional growth in SE Asia revenues of 178.8% on y-o-y basis, on account of establishment of a local team. Operating EBDITA grew by 40.9% on y-o-y to $55.2 million. The company delivered an operating net profit after tax of $21.9 million, depicting a gain of 40.1%. The company reported increased sales from plant-based beverage operations, reflecting growth in retail and out of home brands, with operating earnings contribution materially ahead of the prior year period. The company reported its EBITDA margin at 11.6%, increased from 11.1% in FY18.
Balance-sheet Highlights: The company reported its cash and cash equivalents of $55.385 million and current assets of $266.807 million as on 30 June 2019. Total assets stood at $984.894 million while the company reported its net assets at $670.857 million as on 30 June 2019. The company reported borrowings of $128.395 million, increased from $124.461 million in FY19
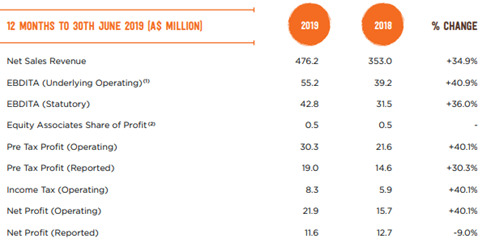
FY19 Financial Highlights (Source: Company Reports)
Stock Update: The stock of FNP closed at $4.74 with a market capitalization of $1.26 billion on 14 February 2020. The stock is available at a price to earnings multiple of 101.07x on its trailing twelve months (TTM) basis. At current market price, the stock has generated a dividend yield of 1.16% on annualized basis. The stock has generated a mixed return of -18.42% and 15.05% in the last three months and six months, respectively. The 52 weeks high and low of the stocks stood at $5.98 and $3.950.
