


Evolution Mining Limited (ASX: EVN) share prices are on a bull run. The share prices of the company are moving in a long-term uptrend; while the recent uptrend started from the level of A$2.605 (Dayâs low on 31st September 2018).
The recent uptrend rally which started post-correction of the previous long-term up rally (began in 2015) stalled at A$4.080 (Dayâs high on 1st February 2019), from where the share prices of the company took a correction to the level of A$3.040 (Dayâs low on 3rd May 2019).
The shares resumed the recent uptrend after reaching the level of A$3.040 till the present level of A$3.870 (Dayâs close on 31st May). A rally of around 27%.
The rally of May 2019 marked a significant gain after a 3- months decline from the level of A$4.080 till A$3.040. A 25.49% drop in prices.
On the fundamental aspect, the Return on Asset of the company inched up by 23% recently, which the company mentioned at BAML global metals mining and steel conference.
Evolution on Charts:
 EVN Daily Chart (Source: Thomson Reuters)
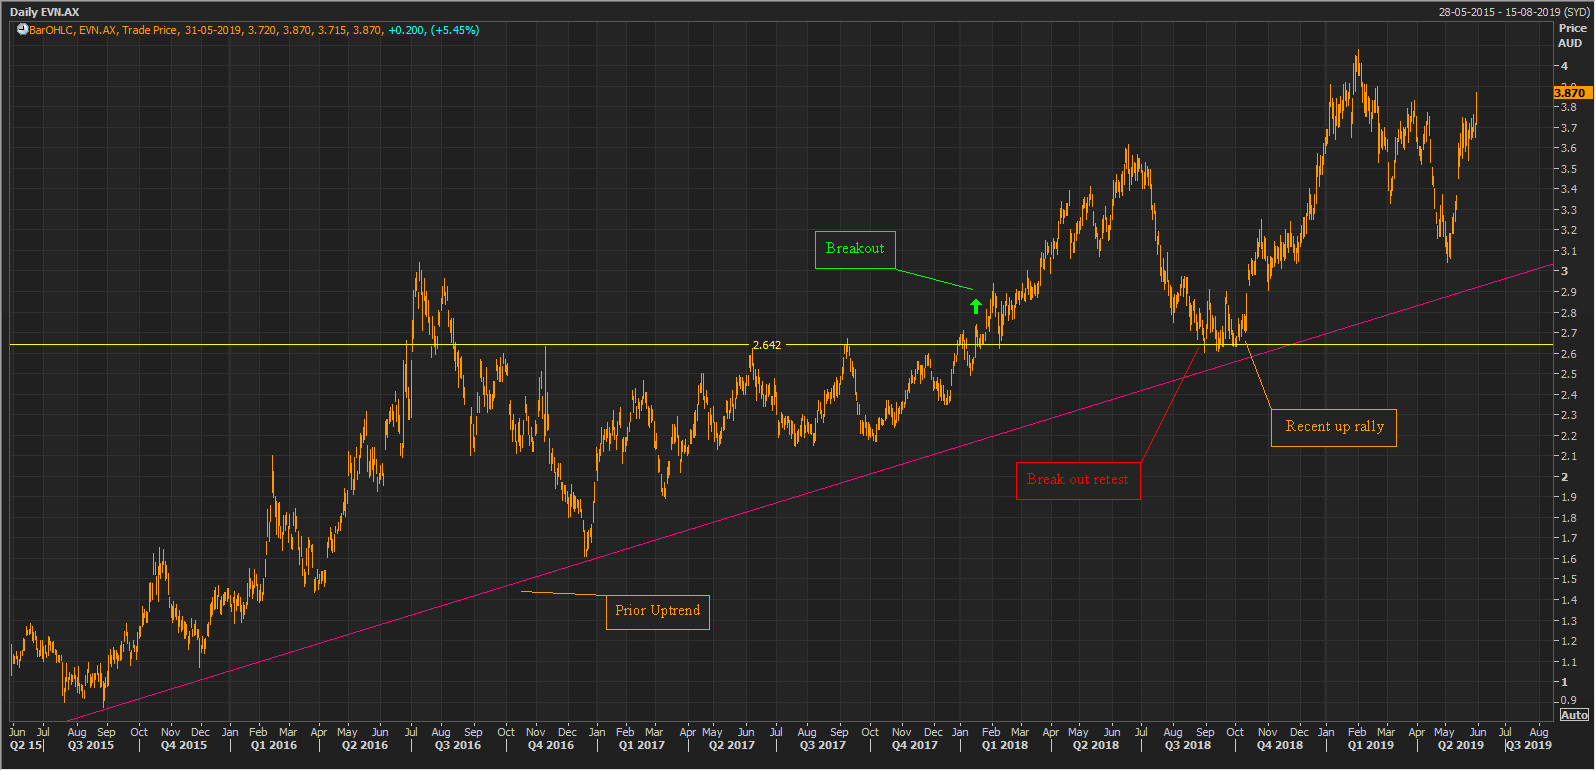
The long-term analysis of the chart suggests that the share prices are moving in a continuous uptrend since the third quarter of the year 2015, marked with a pink upward sloping line on the charts.
The prices made an ascending triangle formation with horizontal highs and the upward sloping line. Post giving a break out the share prices of the company rose significantly to the level of A$3.615 (Dayâs high on 19th June 2018) and retraced back to retest the breakout level.
After retesting the breakout level, the share prices of the company again moved in an uptrend, which we defined as a recent uptrend above.
 EVN Daily Chart (Source: Thomson Reuters)
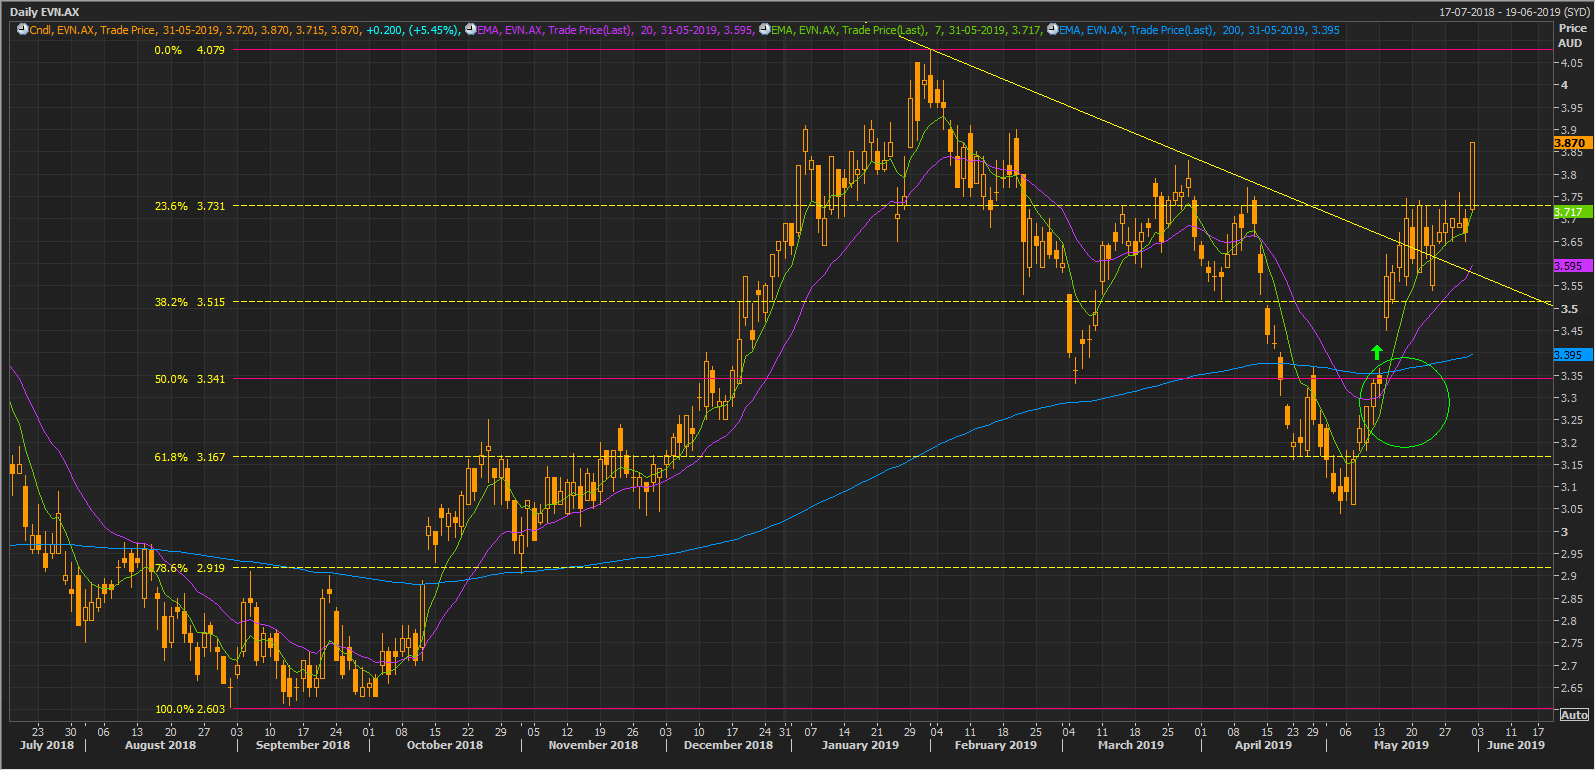
The recent rally, which started from the level of A$2.605 stalled at A$4.080, and the prices retraced back and marked a correction of approx. 50% before moving up again to the level of A$3.830 (Dayâs high on 28th March 2019).
The prices soon faced a hurdle of the downward sloping (yellow) trendline and further corrected by approx. 65% before resuming the uptrend again.
However, during this time, the prices took the support of a Golden Cross-over (bullish signal), which emerged on a daily chart, when the dual exponential averages of 7 and 20-days crossed the medium-term exponential moving average of 200-days from below. The Golden Cross-over is marked with a green contour on the chart shown above.
With golden cross supporting the prices, the prices managed to breach the resistance offered by the downward sloping trendline and rose to the present level of A$3.870 (Dayâs close on 31st May 2019), up by 5.45% as compared to its previous close.
However, after a breakout of the downward sloping trendline, the prices retraced slightly to the level of A$3.540 (Dayâs low on 23rd May 2019).
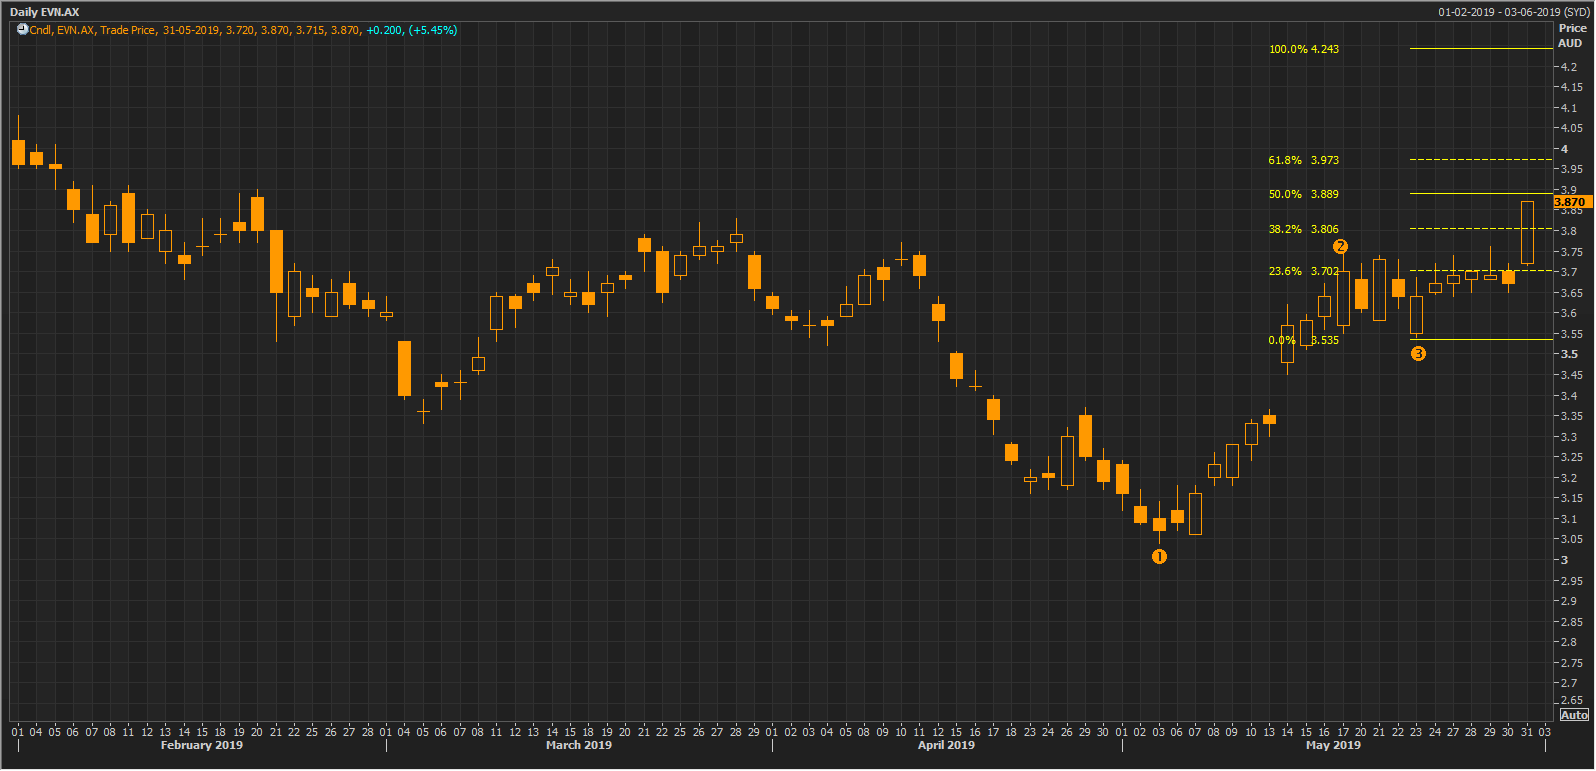
A high followed by a slight correction on the daily chart gave as perfect three points to connect the Fibonacci series. The results of the Fibonacci series (projections) are as:
 EVN Daily Chart (Source: Thomson Reuters)
23.6% (A$3.702), 38.2% (A$3.806), 50.0% (A$3.889), 61.8% (A$3.973), 100.0% (A$4.243)
Performance:
The shares prices of the company have delivered a rate of return of 0.82% on YTD basis; however, the six months rate of return stands at 16.88%, while the three-months rate of return stands at 7.94%.
Disclaimer
This website is a service of Kalkine Media Pty. Ltd. A.C.N. 629 651 672. The website has been prepared for informational purposes only and is not intended to be used as a complete source of information on any particular company. Kalkine Media does not in any way endorse or recommend individuals, products or services that may be discussed on this site. Our publications are NOT a solicitation or recommendation to buy, sell or hold. We are neither licensed nor qualified to provide investment advice.
