


For buying any security/scrip, one of the most important aspects to look for is the momentum of the security. It should be noted that momentum should not to be confused with the trend. A trend is the overall direction of the security in which it is moving, but the momentum is the strength of the trend. To be more precise, âMomentum is the measurement of the speed or velocity of price changeâ according to financial analyst, John J. Murphy. Therefore, it may be possible that the trend is up, but the momentum is decreasing or vice versa, which gives an early indication of a fading trend. To understand more, let us look at a brief analysis of some scrips.
Nuhera Limited (ASX:NUH) is one such stock discussed on momentum front.
Nuhera is a developer of personal hearing devices based on the premise of wearable hearing technology. In the last six months, the stock has fallen about 14% and has been primarily in the red zone. From technical standpoint, one of the key indicators that helps to determine the momentum of the security is moving average convergence divergence (MACD); and as seen in the price chart of Nuhera Limited, from 10th December 2018, the prices have broadly moved in a range of A$0.085 on the upper side and A$0.067 on the lower side. Consequently, the MACD has also moved in a range, not specifying any one-sided momentum. However, on 4th March 2019, the MACD had closed at its lowest value in the past two months. This was an indication that the price momentum is shifting downwards and soon the prices may break down out the existing range. Although MACD had already given a bearish indication at A$0.074 around 21st February 2019, when it crossed below its signal line and since then the stock had already made a low of A$0.068, as of 8th March 2019. Overall, the technical scenario has looked a bit bleak on NUH. On the other hand, the group lately released its interim H1 FY19 results wherein the company emphasised on the enhanced sales with the help of its newly launched IQbuds BOOSTâ¢. The company still reported loss for the half year and is yet to improve the financial performance.
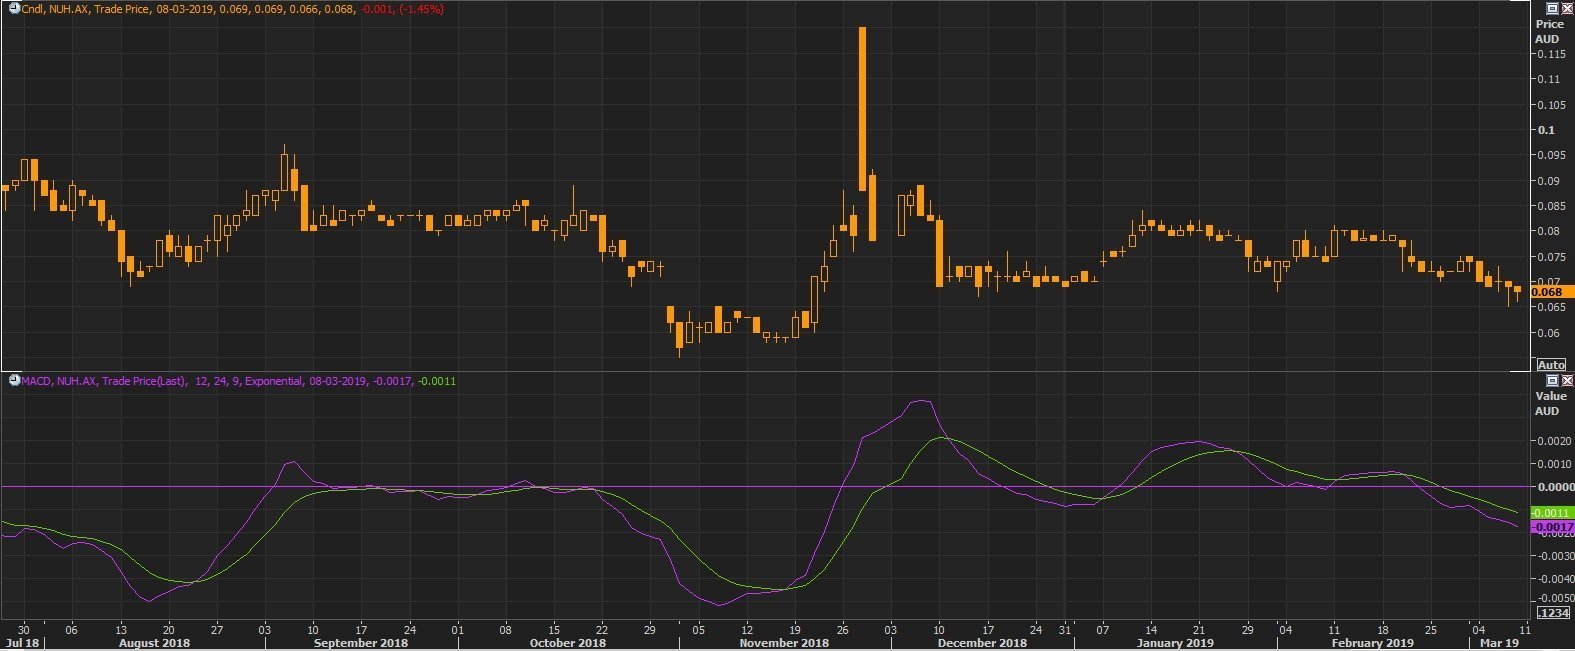 NUH Daily Chart as at March 08, 2019 (Source: Thomson Reuters)
Another healthcare company is Bionomics Ltd (ASX:BNO) that has been on investorsâ radar.
Bionomics Ltd is a biopharmaceutical company based in Australia. In the BNOâs daily chart as provided below, there is a price scenario at the top and price rate of change (ROC) at the bottom. The ROC measures the momentum of the stock based on the rate of change of price relative to previous days.
In September 2018, the ROC gave a very negative reading and gave an indication of a potential downtrend. In the next trading session which took place in early October 2018, the price opened massively lower. Consequently, ROC fell to almost -65% during this fall. After then momentum got back to neutral as ROC went to 0 level and started hovering around that level till the stock was in the consolidation phase. In February 2019, the stock went out of consolidation with a big gap up opening (indicating a new trend), and the ROC also gave a breakout (indicating high strength of the potential trend). After the breakout, the stock has moved up but soon reversed on the downside with increasing momentum as seen in the price chart below.
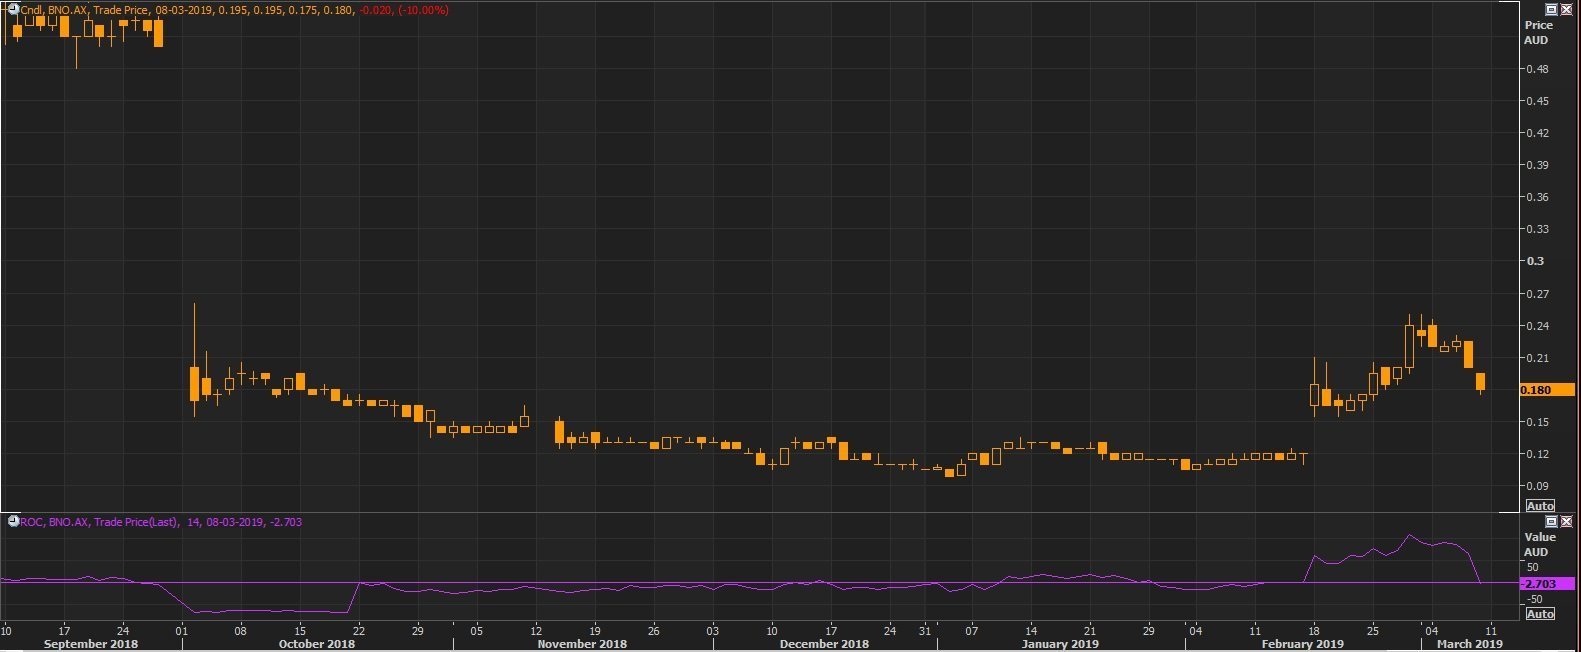 BNO Daily Chart as at March 08, 2019 (Source: Thomson Reuters)
While the stock seemed to have rebounded, the momentum got disrupted in the trading session for March 08, 2019, when the stock price fell by about 10% with the announcement of removal from the All Ordinaries Index effective March 18, 2019 as per the S&P/ASX Indices quarterly rebalance. This has again raised some alarming situation while the investors might want to stay on the side-line.
Disclaimer
This website is a service of Kalkine Media Pty. Ltd. A.C.N. 629 651 672. The website has been prepared for informational purposes only and is not intended to be used as a complete source of information on any particular company. Kalkine Media does not in any way endorse or recommend individuals, products or services that may be discussed on this site. Our publications are NOT a solicitation or recommendation to buy, sell or hold. We are neither licensed nor qualified to provide investment advice.
