


S&P/ASX 200
S&P/ASX 200 index comprise 200 largest ASX listed stocks, which together account for more than 80% of Australiaâs stock market capitalization ranging in size between ~$400 Mn to more than $100 Bn.
Rebalance activities of this index are conducted in the month of March, June, September and December. In case of any significant event such as delisting and merger, provision of an intra-quarter rebalance is also there.
Criteria for any stock for the inclusion in the index states that the stock must be listed on the Australian Securities Exchange as an ordinary or preferred stock; stock must satisfy the liquidity requirements but not dominated by a small group of investors; and stockâs float-adjusted market capitalization must also satisfy index requirements i.e. float-adjusted market capitalization must be amongst the largest 200 on the ASX.
S&P/ASX 200 index at the time of writing was trading at $6739.7 (on 13 December 2019). Looking at the historical data, the index made similar levels at $6851.50 long back on November 1, 2007 and fell to a level of $3120.80 on March 10, 2009.
S&P 500
S&P 500 measures performance of 500 large companies stock listed on American stock exchange and is maintained by S&P Dow Jones Indices, which is a joint venture majorly owned by S&P Global and its components. The index is a float-weighted index where companyâs shares are publicly available for trading.
The index at the time of writing traded at US$3168.57 (December 12, 2019).
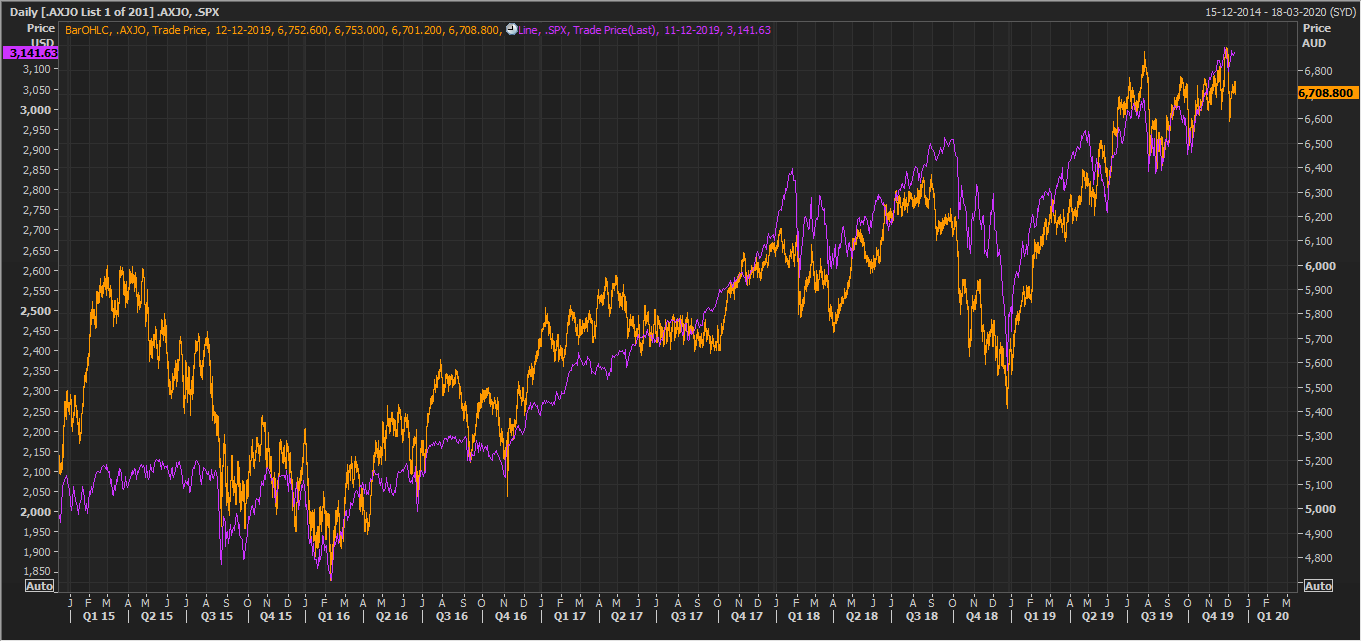
ASX 200 Vs. S&P 500 Past Five Year Performance (Source: Company Reports)
Three highest market-cap stocks in the S&P/ASX 200 index are BHP Group Limited, Commonwealth Bank of Australia and Rio Tinto Limited. On the other hand, three highest market-cap stocks in the S&P 500 index are Apple Inc (NASDAQ:AAPL), Microsoft Corporation (NASDAQ:MSFT) and Alphabet Inc. (NASDAQ:GOOGL).
Letâs take a closer look at these stocks-
ASX 200 stocks
BHP Group Limited (ASX:BHP) has operation in exploration, development and production of oil and gas; mining of gold, uranium, molybdenum, zinc, silver, copper, iron ore, metallurgical and energy coal.
On December 13, 2019, the stock of BHP traded at $39.350 with price to earnings (PE) multiple and Earnings per share of 16.890x and $2.286, respectively. Its 52-week high and low-level stand at $42.330 and $29.953, respectively, at average daily volume of 5,623,386. Its annual dividend yield was noted at 4.97% with 100% franking.
Commonwealth Bank of Australia (ASX:CBA)
Commonwealth Bank of Australia operates in retail banking services, business and private banking, institutional banking and markets, wealth management, ASB New Zealand and international financial services.
On December 13, 2019, the stock of CBA traded at $80.060 with price to earnings (PE) multiple and Earnings per share of 16.420x and $4.856, respectively. Its 52-week high and low-level stand at $83.990 and $67.550, respectively. Its annual dividend yield was noted at 5.41% with 100% franking.
Rio Tinto Limited (ASX:RIO) has operation in the exploration, production, development and processing as well as marketing of mineral resources.
On December 13, 2019, the stock of RIO traded at $100.600 with price to earnings (PE) multiple and Earnings per share of 8.660x and $11.435, respectively. Its 52-week high and low-level stand at $106.922 and $68.551, respectively. Its annual dividend yield was noted at 4.75% with 100% franking.
S&P 500 Stocks
Apple Inc (NASDAQ:AAPL)
Apple Inc (NASDAQ:AAPL) is worldâs leading electronic and computer companies.
On December 12, 2019, the stock of AAPL traded at US$271.46 with price to earnings (PE) multiple and Earnings per share of 22.91x and US$11.85, respectively. Its 52-week high and low-level stand at US$271.00 and US$142.00, respectively. The stock currently has an annual dividend yield was noted at 1.147 per cent.
Microsoft Corporation (NASDAQ:MSFT)
American multinational company, Microsoft Corporation (NASDAQ:MSFT) develops, manufactures, licenses, supports and sells software, electronics and related services.
On December 12, 2019, the stock of MSFT traded at US$153.24 with price to earnings (PE) multiple and Earnings per share of 28.86x and US$5.31, respectively. Its 52-week high and low-level stand at US$152.50 and US$93.96, respectively. The stock currently has as annual dividend yield was noted at 1.349 per cent.
Alphabet Inc. (NASDAQ:GOOGL)
Alphabet Inc. (NASDAQ:GOOGL), the part company of Google, has specialization in internet-related services and products which include online advertising technologies, search engines, cloud computing, software as well as in providing electronic hardware.
On December 12, 2019, the stock of GOOGL traded at US$1348.49 with price to earnings (PE) multiple and Earnings per share of 28.94x and US$46.60, respectively. Its 52-week high and low-level stand at US$1,357.55 and US$977.66, respectively, with 50 Day Average Vol. of 1,342,101.
Disclaimer
This website is a service of Kalkine Media Pty. Ltd. A.C.N. 629 651 672. The website has been prepared for informational purposes only and is not intended to be used as a complete source of information on any particular company. Kalkine Media does not in any way endorse or recommend individuals, products or services that may be discussed on this site. Our publications are NOT a solicitation or recommendation to buy, sell or hold. We are neither licensed nor qualified to provide investment advice.
