

_07_20_2026_01_11_05_769979.jpg)


Following a torrid last year, the financial industry of Australia is undergoing a significant change. The financial institutions are refreshing their strategies in order to keep up with change. Today (i.e., 26th July 2019), ASX 200 Financial Index was down on ASX by 0.66%. In light of this, letâs look at a few financial stocks and how they have performed today.
Bank of Queensland Limited (ASX:BOQ)
Australia's leading regional bank, Bank of Queensland Limited (ASX: BOQ) was prompted to decrease its dividend to 34 cents per share in H1FY19, owing to the challenging revenue and cost environment, which BOQ and the industry faced. Since then, the bank is trying to maintain a strong capital position to bolster its future growth.
The group recently reported a total Common Equity Tier 1 (CET1) capital of $3,760 million for the May quarter, lower than $3,845 million in the previous quarter. As at 31st May 2019, the bank had a total capital base of $3,742 million, which is $58 million lower than the previous quarter.
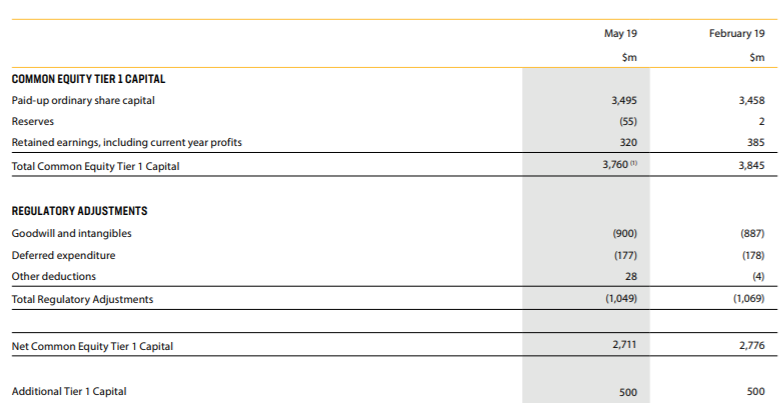
Capital Structure (Source: Company Reports)
At the end of the quarter, the bank had Total Risk Weighted Assets of $30,317 million and Total Liquid Assets of $6,745 million. During the quarter, the company reported net cash outflows of $4,804 million. The bank ended the May quarter with a liquidity coverage ratio of 141%.
Board Changes: The Bank recently announced the appointment of highly experienced Peter Sarantzouklis for the role of Group Executive of BOQ Business. Mr Sarantzouklis has over 23 years of experience in the Banking and Finance sector and most recently, he was the Chief Product Officer (CPO) of Westpac Groupâs Consumer Bank.
In the month of June, BOQ announced the resignation of Mr Matt Baxby who was working as CFO from the past 12 months. In the month of June, the bank also announced the appointment of banking industry veteran, George Frazis as its new MD & CEO.
On the stock performance front, in the past six months, BOQâs stock has exhibited a return of -10.02% as on 25th July 2019. The stock is trading at a PE multiple of 11.580x and has an annual dividend yield of 7.78%. BOQâs stock, at market close on 26th July 2019, was trading at a price of $9.250, with a market cap of circa $3.775 billion and a daily volume of ~1,834,192. The stock has 52 weeks high price of $11.710 and 52 weeks low price of $8.700, with an average volume of ~2,080,786. BOQâs stock has provided a year-to-date return of -2.73% to its shareholders.
CYBG PLC (ASX:CYB)
An independent banking group, CYBG PLC (ASX: CYB) recently announced its four new strategic pillars:
- Pioneering Growth â Under this, the group is reshaping its balance sheet mix by focusing on growth in margin accretive assets and lower cost relationship deposits, supported by new customer propositions;
- Delighted Customers and Colleagues â The group has intensified its focus on enhancing both the customers and colleague experience;
- Super Straightforward Efficiency â The group intends to realise significant integration synergies, as well as plans to digitise and simplify the business to drive incremental cost efficiencies;
- Discipline and Sustainability â Further, the group is maintaining its disciplined approach to risk and the efficient use of capital in order to deliver sustainable shareholder returns.
To support its new refreshed strategy, the group has established three new divisions:
- Business â From this division, the group is planning to roll-out its successful relationship proposition nationwide and launch Virgin Money for business;
- Personal â The group intends to develop and launch rewards-led relationship propositions to drive customer growth;
- Mortgages â The group is planning to digitise, optimise and maximise its mortgage proposition to unlock greater value.
The group recently reaffirmed its 2019 guidance of 165 to 170 bps NIM and £950 million of underlying costs. By the year FY22, the group expects to achieve £200 million in net cost savings.
In the first half of FY19, the group witnessed a resilient underlying financial performance, which includes earning of pro forma underlying profit before tax of £286 million, which was 5% lower than pcp along with the total underlying income of £843 million, in line with both H1 â18 and H2 â18.
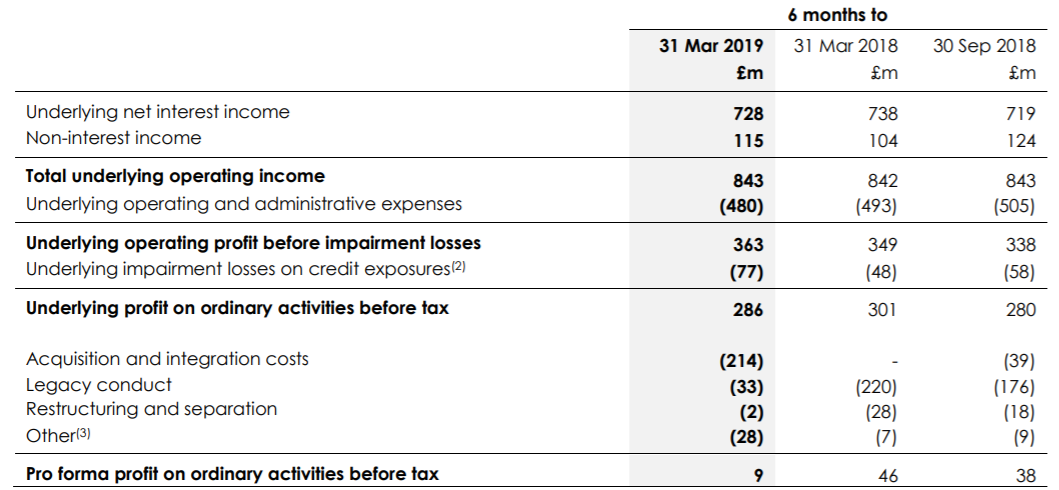
Half Year Results (Source: Company Reports)
On the stock performance front, in the past six months, CYBâs stock has exhibited a return of 3.94% as on 25th July 2019. On 26th July 2019, at market close, CYBâs stock was trading at a price of $3.600, down by 2.439%, with a market capitalisation of circa $5.29 billion and a daily volume of ~2,451,808. The stock has 52 weeks high price of $6.360 and 52 weeks low price of $3.100, with an average volume of ~3,684,851. CYBâs stock has provided a year-to-date return of 13.19% to its shareholders.
Steadfast Group Limited (ASX:SDF)
A leading group of underwriting agencies in Australasia, Steadfast Group Limited (ASX: SDF) recently announced a proposed alliance with Insurance Brokers Network Australia Limited. Although the company has entered into an agreement with IBNA, the agreement is still subject to further due diligence and all other necessary regulatory requirements.
In the first half of FY19, the company reported strong growth in its underlying earnings, which was primarily driven by organic and acquisition growth.
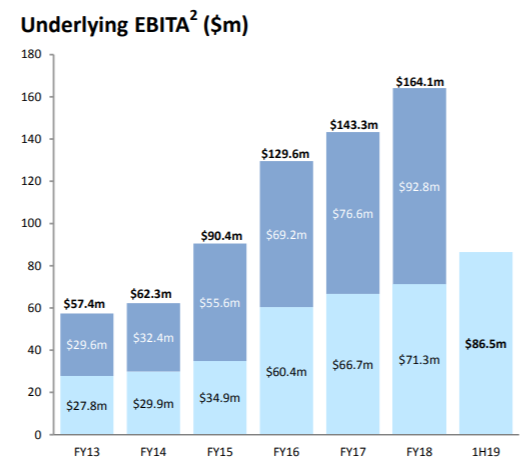
Underlying EBITA for H1 FY19 (Source: Company Reports)
For the half year period, the company reported EBITDA of $86.5 million, which was 21.3% higher than the previous corresponding period (pcp). In H1 FY19, the company earned statutory NPAT of $40.5 million, which was 19.8% higher than pcp.
During the half year period, the company reported gross written premium of $2.9 billion, which was 12% higher than pcp, driven by volume and price increases and new brokers joining the network over the period.
Recently, Vanguard Group became a substantial holder of the company by holding 44,190,384 ordinary shares with 5.672% voting power.
On the stock performance front, in the past six months, SDFâs stock has exhibited a return of 41.67% as on 25th July 2019. The stock is trading at a PE multiple of 35.620x and has an annual dividend yield of 2.11%. At market close on 26th July 2019, SDFâs stock was trading at a price of $3.650, down by 2.406% intraday, with a market capitalisation of circa $2.97 billion and a daily volume of ~2,192,607. The stock has 52 weeks high price of $3.840 and 52 weeks low price of $2.490, with an average volume of ~1,949,684. SDFâs stock has provided a year-to-date return of 40.07% to its shareholders.
Disclaimer
This website is a service of Kalkine Media Pty. Ltd. A.C.N. 629 651 672. The website has been prepared for informational purposes only and is not intended to be used as a complete source of information on any particular company. Kalkine Media does not in any way endorse or recommend individuals, products or services that may be discussed on this site. Our publications are NOT a solicitation or recommendation to buy, sell or hold. We are neither licensed nor qualified to provide investment advice.
