


As per the leading digital travel business company, Webjet Limited, the outlook for the travel industry is positive, notwithstanding the uncertainties caused by factors we cannot control such as a global trade war, Brexit, climactic events and perceptions of over-tourism.
The below-mentioned companies are major players of the Australian travel industry. All these companies have released their FY19 results today (i.e., 22nd August 2019). Letâs take a look at the financial and operational performances of these travel stock
Qantas Airways Limited (ASX:QAN)
Australiaâs leading airline company, Qantas Airways Limited (ASX: QAN) has delivered an Underlying Profit Before Tax of $1.3 billion, a decrease of $263 million from FY2018, impacted by an $614 million increase in fuel costs from higher oil prices and a further $154 million of the foreign exchange impacts on non-fuel net expenditure.
The company earned a statutory profit after tax of $891 million for FY19, down by around $62 million as compared to FY18. The companyâs return on investment also decreased to 18.4% in FY19 from 21.4% in FY19.
At the end of FY19, the company had Net Debt of $4.7 billion, which is lower than the Net Debt target range of $5.2 billion - 6.5 billion. During the year, the companyâs strong cash flow generation ability delivered $2.8 billion in operating cash flow. The FY19 operating cash flow was lower than FY18, due to lower working capital benefits, the timing of option premium outflows and the recommencement of payment of Australian income taxes.
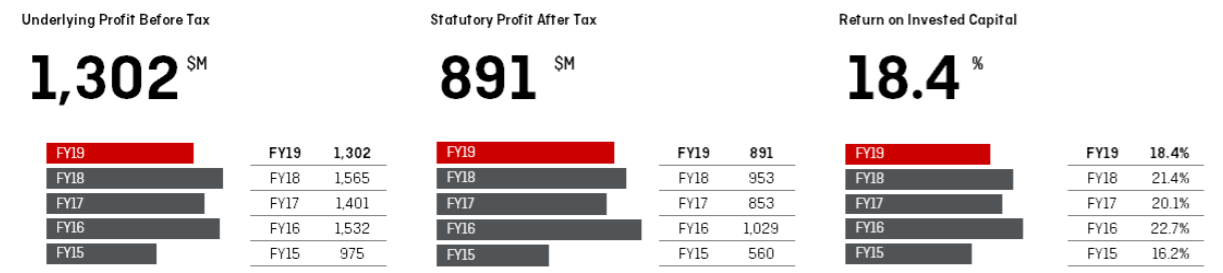 FY19 Results Snapshot (Company Reports)
In FY19, the company incurred a net capital expenditure of $1.6 billion and returned $1.0 billion of surplus capital to shareholders through $363 million of fully franked dividends and $637 million of on-market share buy-backs.
On 22 August 2019, the company announced an off-market share buy-back of up to 79.7 million of its shares. The Buy-Back will be conducted through a tender process in which Eligible Shareholders who choose to participate can offer to sell some or all of their Shares to Qantas.
The company has also decided to distribute a 13 cents per share fully franked final dividend, totalling $204 million.
Qantas Domestic earned Underlying EBIT of $1.03 billion in FY19, down by 4% on last year. During the year, the Unit Revenue from Qantas and Jetstarâs domestic operations increased by a combined 4% on flat capacity, as fares caught up to higher oil costs. In FY19, Qantas Domestic achieved its second-highest Underlying Profit was able to increase its Unit Revenue by 5%. Seat factors were steady at 78% during the year.
Qantas International reported an Underlying EBIT of $285 million, down by 28% on last year. It is to be noted that the group witnessed significant improvement in second half performance, as competitor capacity and overall fare levels adjusted to higher fuel prices.
Qantas Loyalty achieved a record Underlying EBIT of $374 million, which is 8 per cent higher than FY2018.
In FY2020, the company is expecting its total fuel bill to increase to ~A$3.95 billion. Gross capital expenditure is expected to be $2.0 billion for FY20 while the companyâs net underlying depreciation and amortisation is expected to be ~$130 million higher than FY19.
Stock Performance: In the past six months, QANâs stock has provided a return of 0.17% as on 21 August 2019. QANâs stock is trading at a PE multiple of 11.120x and an annual dividend yield of 3.81%. At market close on 22 August 2019, QANâs stock was trading at a price of $5.860, up by 1.384% intraday, with a market capitalisation of circa $9.08 billion.
Flight Centre Travel Group Limited (ASX:FLT)
A Leading travel agency group, Flight Centre Travel Group Limited (ASX: FLT) has revealed its FY19 results today (i.e., 22nd August 2019). In FY19, the group has witnessed an increase of 8.8% in its total transaction value (TTV) as compared to FY2018. The TTV was recorded at $23.7 billion for FY19, exceeding FY18 TTV by around $2 billion.
For the full year, the companyâs international businesses and its corporate travel operations delivered solid profit growth.
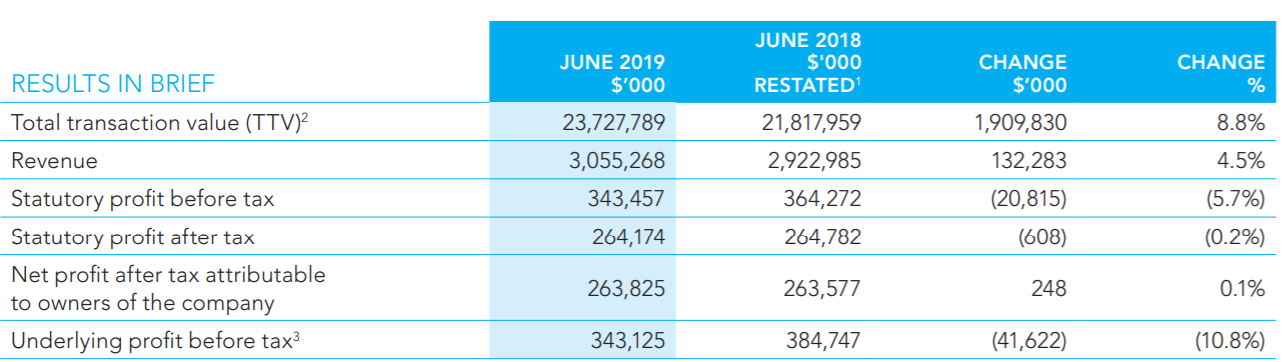 FY19 Results Snapshot (Source: Company Reports)
The company earned revenue of around 3.05 million in FY19, up 4.5% on FY18.
One of the major highlights of FY19 is the record dividend payment of around $3.07 per share consisting of $0.98 final dividend and the $1.49 special and $0.60 interim dividends.
During the year, the company completed various acquisitions and investments that collectively bolstered the companyâs technology platforms and offerings. The acquisitions also helped in expanding the corporate travel footprint.
At the end of FY19, the company had global cash and investment portfolio of $1.29 billion, compared to $1.48 billion one year earlier. Over the full year, the company witnessed a $278.9 million operating cash inflow, compared to a $314.3 million inflow during FY18.
The company is planning to release its FY20 guidance at its Annual General Meeting (AGM) in November 2019. The company believes that its FY2020 results will be driven by the companyâs corporate and international businesses.
For Flight Centre brand in Australia, key short-term priorities include:
- Growing TTV across specialist businesses and via channels;
- Improving operational performance through new customer centric initiatives, better use of data and by working with consultants;
- Simplifying the product-to-market approach and delivering irresistible deals, including cheapest, best and premium options.
Stock Performance: In the past six months, FLTâs stock has provided a return of 2.34% as on 21 August 2019. FLTâs stock is trading at a PE multiple of 18.010x and an annual dividend yield of 3.81%. At market close on 22 August 2019, FLTâs stock was trading at a price of $47.140, up by 7.527% intraday, with a market capitalisation of circa $4.43 billion.
Webjet Limited (ASX:WEB)
A leading digital travel business, Webjet Limited (ASX: WEB) delivered a record performance across its key metrics in FY19, driven by organic growth as well as the impact of the JacTravel and DOTW acquisitions. The total Transaction Value (TTV) for continuing operations increased by 27% to $3.8 billion in FY19 as compared to last year. The companyâs revenue also increased by 26% to $366.4 million.
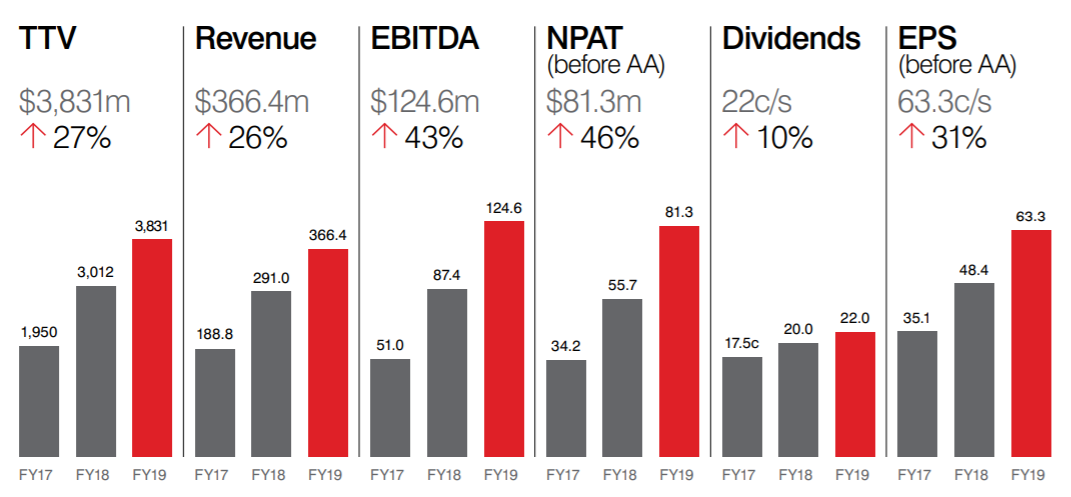 FY19 Results Snapshot (Source: Company Reports)
The results were driven by the increased profitability from WebBeds as well as scale benefits coming through in the Webjet OTA.
The company witnessed a higher TTV and EBITDA margins in all regions. Despite difficult market conditions in both Europe and the Middle East, the company was committed on selling its own directly contracted hotel inventory while maintaining margins. In American region, the company has delivered substantial EBITDA driven by strong bookings growth in North America.
The acquisition of DOTW in FY19 significantly enhanced WebBedsâ global scale, while the launch of Umrah Holidays International provided an opportunity to target 30 million religious visitors every year.
In FY19 the Webjet OTA accounted for approximately 36% of Group TTV, 41% of Group revenue and 43% of Group EBITDA (before corporate costs).
The company has declared a final dividend of 13.5 cents per share, which will be paid on 10 October 2019.
While commenting on the outlook for FY2020, the company Managing Director John Guscic informed that first 6 weeks of trading in FY2020, WebBeds TTV is up over 50% compared to pcp while Webjet OTA TTV is up 9% and Online Republic TTV is up 4%.
Stock Performance: In the past six months, WEBâs stock has provided a negative return of 6.73% as on 21 August 2019. WEBâs stock is trading at a PE multiple of 34.400x and an annual dividend yield of 1.48%. At market close on 22 August 2019, WEBâs stock was trading at a price of $12.700, down by 8.303% intraday, with a market capitalisation of circa $1.88 billion.
Disclaimer
This website is a service of Kalkine Media Pty. Ltd. A.C.N. 629 651 672. The website has been prepared for informational purposes only and is not intended to be used as a complete source of information on any particular company. Kalkine Media does not in any way endorse or recommend individuals, products or services that may be discussed on this site. Our publications are NOT a solicitation or recommendation to buy, sell or hold. We are neither licensed nor qualified to provide investment advice.
