


Gold spot prices have reached around the crucial support level of USD 1,450 in the international market after tumbling for about a week. The recent correction in gold prices has exerted pressure on ASX-listed gold miners, who outperformed global indices in the recent past amid the gold rush.
To Know More, Do Read: A Glimpse Over ASX-Listed Top Performing Mining Stocks
Gold Technical Analysis
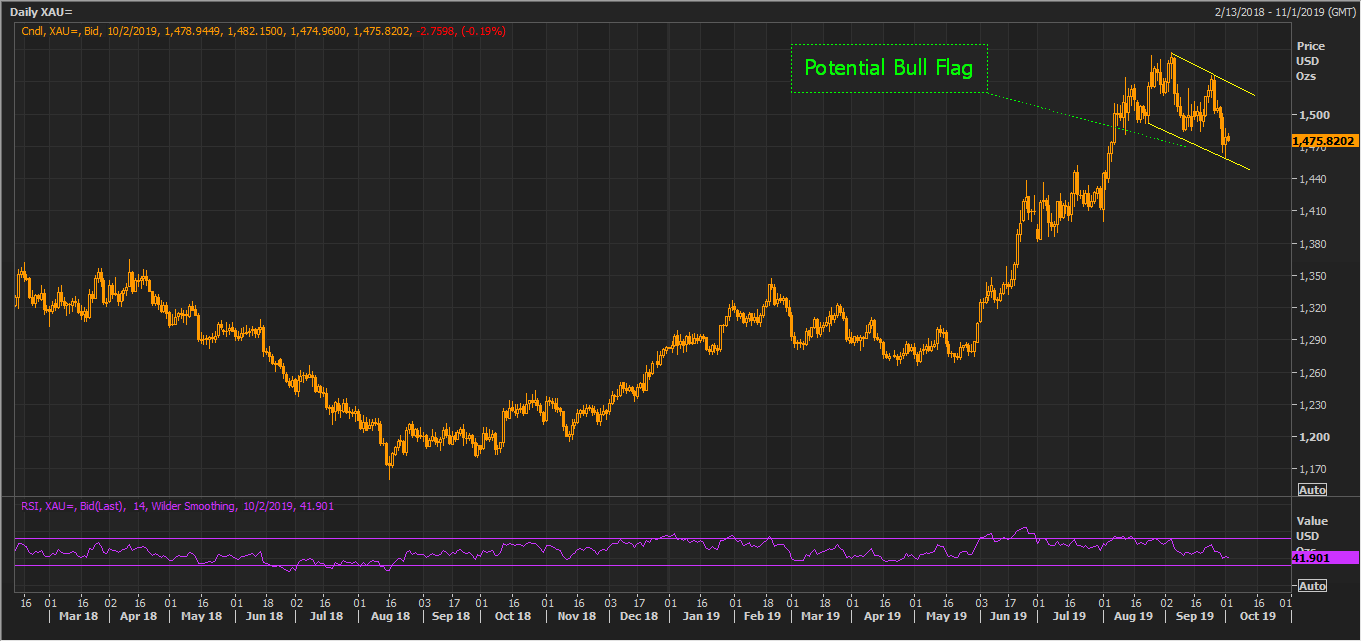
XAU Daily Chart (Source: Thomson Reuters)
On the daily chart, gold prices are currently trading at the crucial support level, which is at the bottom of the potential bullish flag pattern (bullish pattern) formed by the price actions on the daily chart. The prices rose substantially and corrected to form a potential bullish flag.
Currently, the prices are at the bottom of the bullish flag and taking the support of the downward sloping bottom line of the pattern. Investors should keep a close watch around these levels as the strong fundamentals for gold might instigate buyersâ interest in the commodity at the current levels.
The 14-day Relative Strength Index, which is at 41.90 is below the mean average of 50, which indicates gold has entered the sell-zone; however, the bull flag pattern could provide support and raise buyerâs interest to reverse the RSI direction.
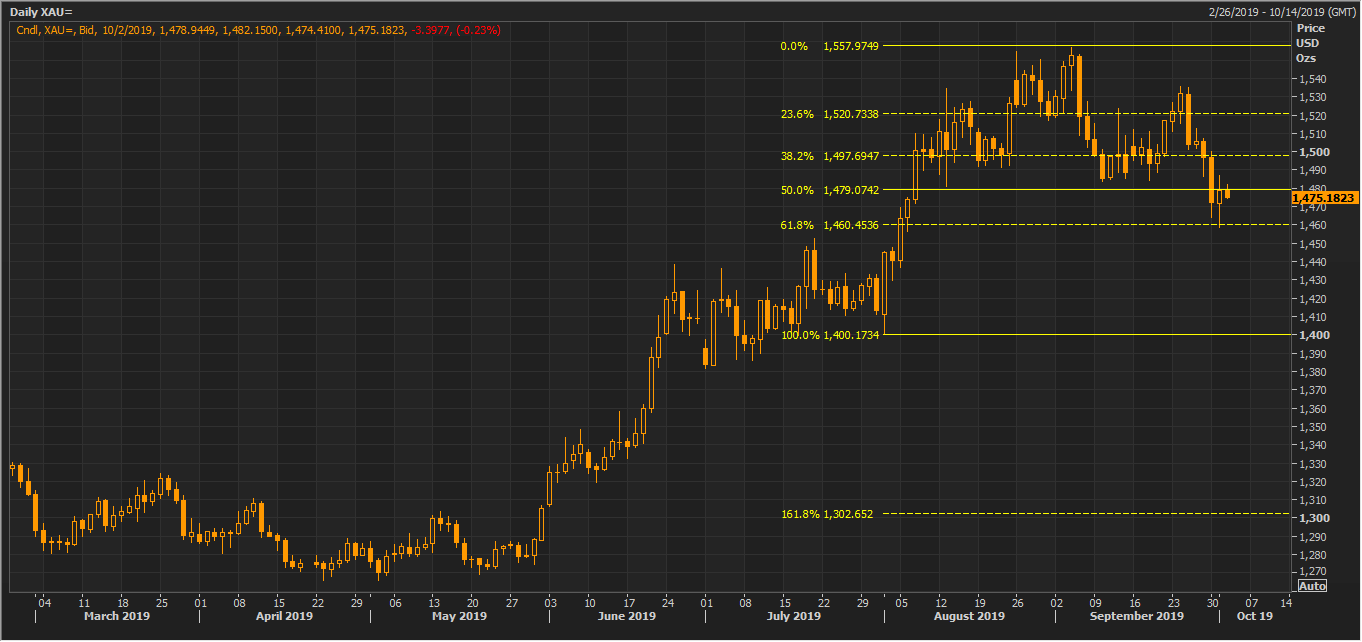
XAU Daily Chart (Source: Thomson Reuters)
The gold spot prices corrected 61.8 per cent of the short-term upside rally, which started from the level of USD 1,400.17 and halted at USD 1,557.97 and took the support of the 61.8 per cent retraced level, which is at USD 1,460.45.
Investors should closely monitor the range of USD 1,460 to USD 1,450 as this represents 61.8 per cent of the retracement and hovering near the downward sloping bottom line of the bullish flag pattern.

XAU Daily Chart (Source: Thomson Reuters)
If the gold prices does not breach the low of the candle marked as (2), the projected Fibonacci series will hold true, and the gold prices could rise to test each of the projected levels; however, investors should monitor market actions at each projected level as these levels act as potential target and potential resistance as well, which in turn, makes them potential point for reversal.
Gold Trend Strength
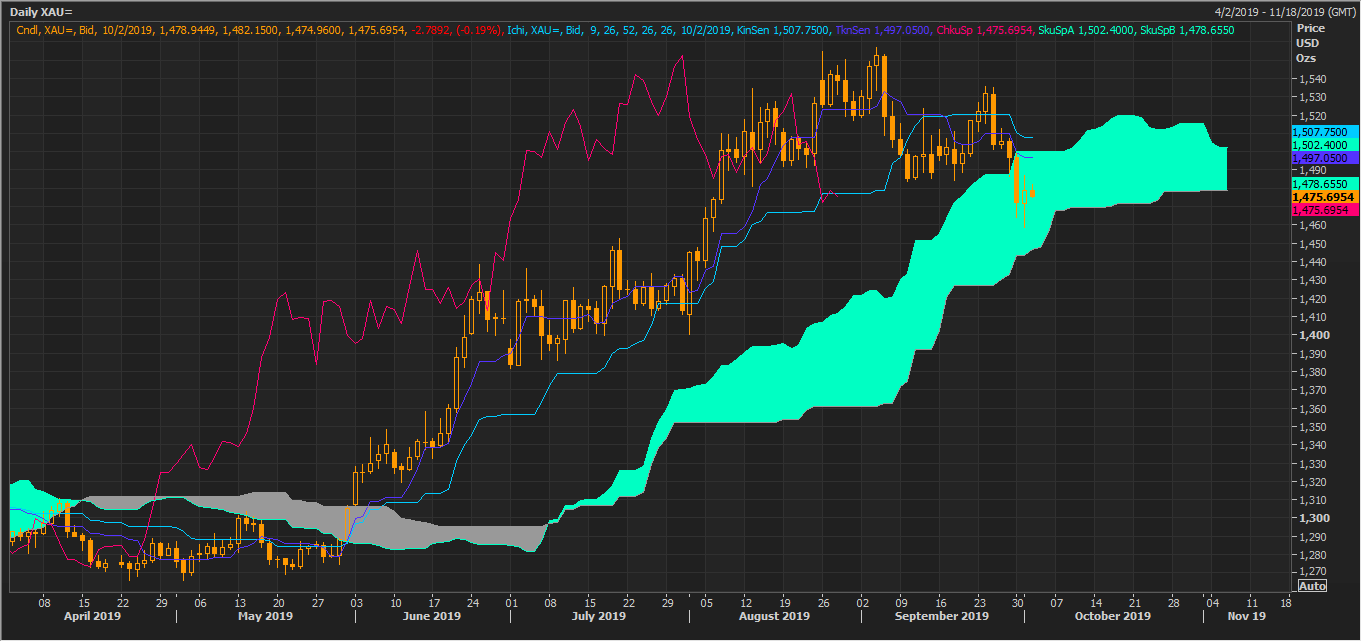
XAU Daily Chart (Source: Thomson Reuters)
After applying the Ichimoku cloud on the daily chart of gold, we can notice that Span A, which is mean of the conversion line and the base line is trading above Span B, which is the mean of 52-week high and low.
The Span A is at USD 1,502.40, while the Span B is at USD 1,478.65, (below Span B), which suggests that the gold is moving in the uptrend. The gold prices took the support of the cloud and rose again during the session on 02 October 2019.
Despite being in a positive trend, the conversion line of the Ichimoku (the mean of 9-day high and low) has crossed the base line (the mean of 26-day high and low) from above, which in turn, is a bearish signal; however, the negative cross took place above the Span A, which is not a very strong signal, albeit still negative.
While gold prices have shown a slight recovery in the international market, the ASX-listed gold miners have started giving negative signs on charts.
ASX-Listed Gold Miners
Resolute Mining Limited (ASX: RSG)
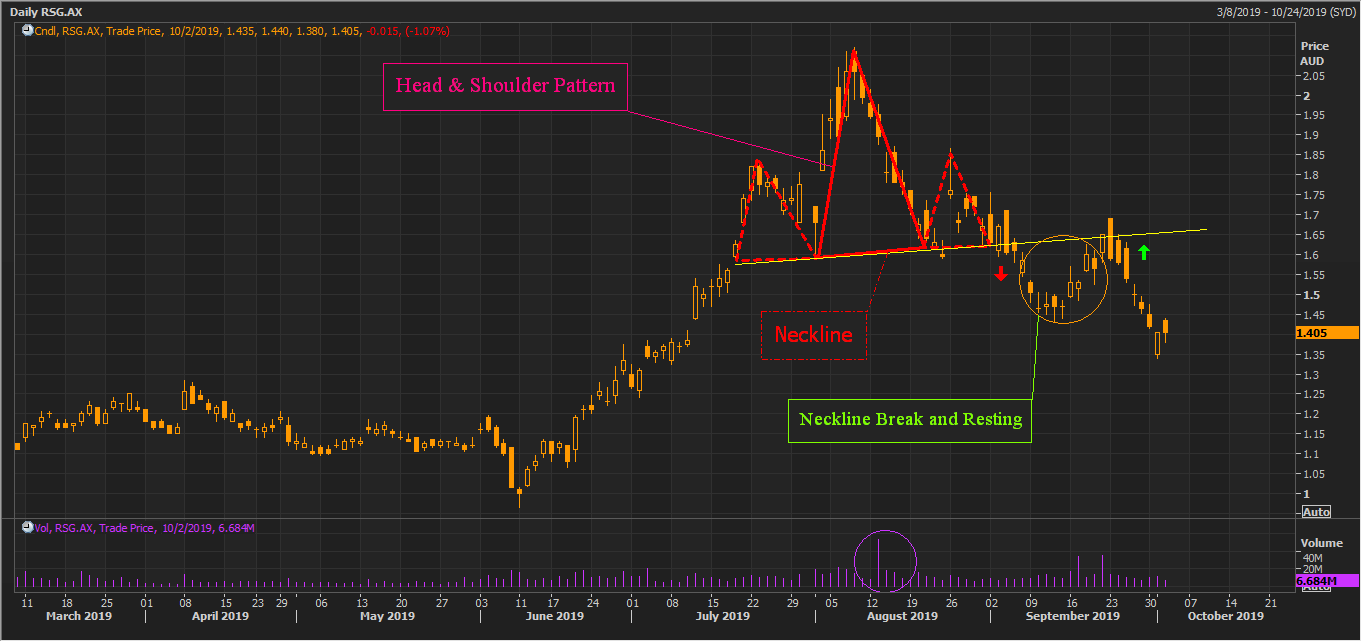
RSG Daily Chart (Source: Thomson Reuters)
On the daily chart, the share prices of the company are forming a classic Head & Shoulder pattern, which is a trend reversal pattern. The Head & Shoulder pattern (bearish pattern) presented itself at the top of the primary upside rally, with a broken-out neckline, which is not a very good sign for RSG.
The share prices rose with slight volume to form the left shoulder and presented spiked volume during the formation of the head with again a decline in volume while forming the right shoulder.
The prices broke out of the neckline and retested the breakout levels and fell again, which confirmed the formation of a classic Head & Shoulder pattern. The academically dedicated target for the prices could be calculated by taking the difference between the neckline and the top of the head and measure the difference to the downside from the neckline.
Albeit, the Head & Shoulder pattern is a well know trend reversal pattern, but there are many instances when such pattern fails, and whether the pattern will hold true or not would be driven by the underlying fundamentals of the company and gold.
Hence, investors should dive deep into fundamentals to confirm the strength and effectiveness of the Head & Shoulder pattern.
Also Read: Gold Rush Led The ASX-listed Gold Miner Shine; A Glimpse Over 10 Gold Stocks
Saracen Mineral Holdings Limited (ASX: SAR)
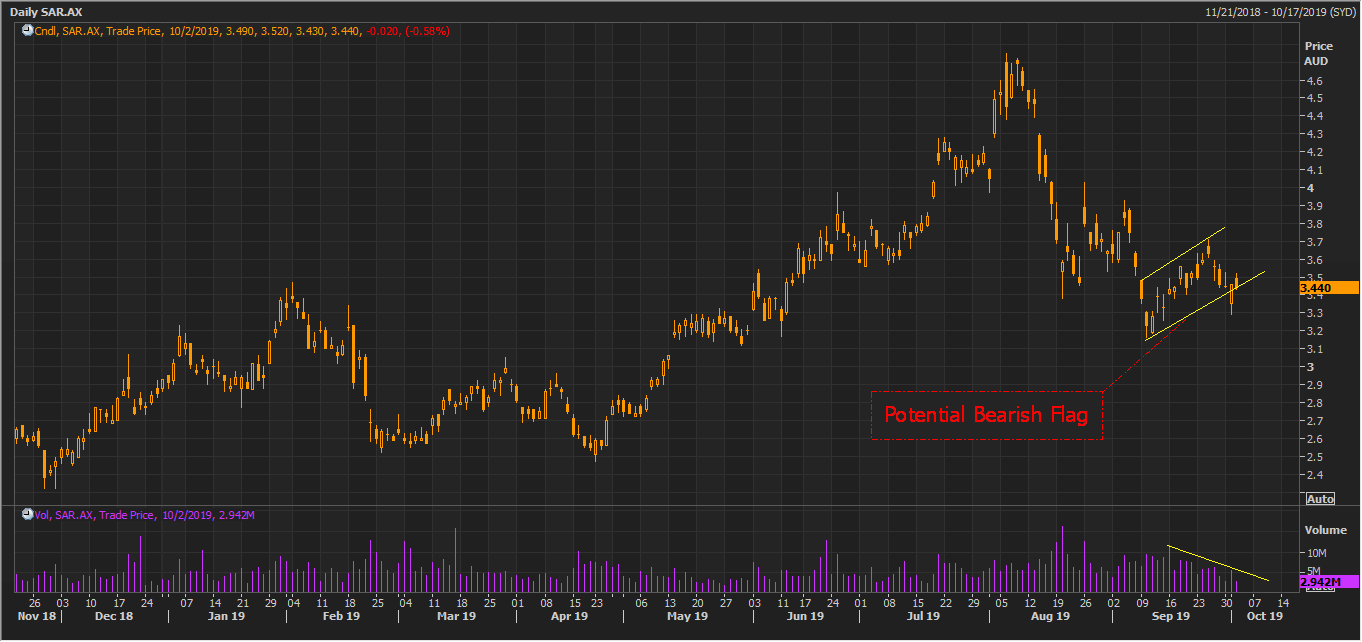
SAR Daily Chart (Source: Thomson Reuters)
On the daily chart, the share prices of the company are forming a potential bearish flag with a pending breakdown. The stock attempted a breakout of the bearish flag; however, it recovered and did not sustain at the breakout levels.
Investors should monitor the stock movement closely in this narrow range and breakout above or below the bearish flag would decide further price actions.
To Wrap up, gold prices are tumbling in the international market; however, the gold prices are currently backed by the net buying from the gold-backed ETFs and central banks. The spot prices are forming a potential bullish flag-which if holds true could propel the gold prices ahead.
Forward Curve and Gold Seasonality
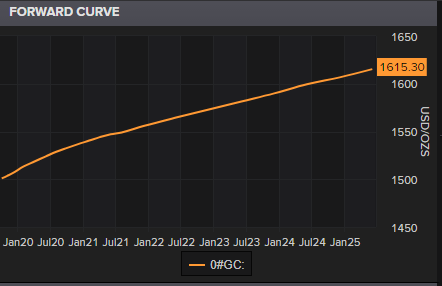
XAU Forward Curve (Source: Thomson Reuters)
The forward curve of gold is smoothened and is linear, which in turn, supports the gold outlook; however, a forward curve could be sometime ill-informed amid its equation, which utilises storage cost and convenience yield to determine the future prices, and both the measure varies from market participants to market participants and from location to location.
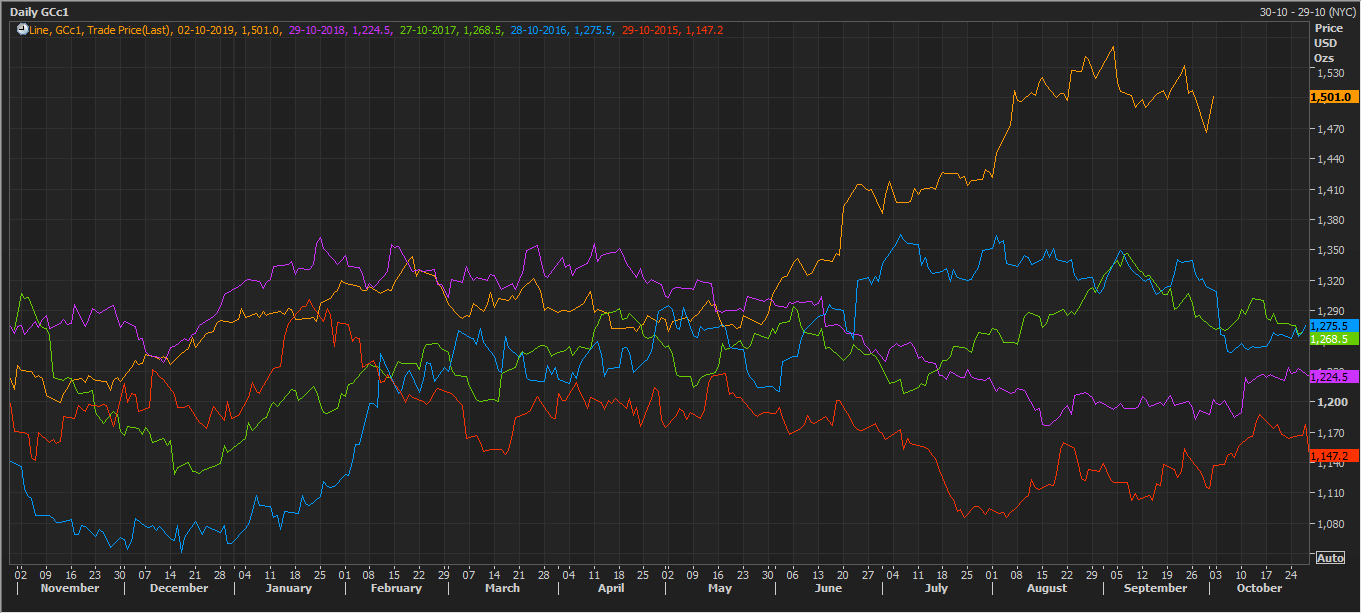
XAU Seasonality Curve (Source: Thomson Reuters)
Despite, strong support for the gold prices, the ASX-listed gold miners are getting discounted and are showing the formation of bearish patterns.
To Know More, Do Read: Global Gold-Backed ETFs Pushes Gold; ASX-listed Gold Stocks Under Pressure Over Bearish Signs
Disclaimer
This website is a service of Kalkine Media Pty. Ltd. A.C.N. 629 651 672. The website has been prepared for informational purposes only and is not intended to be used as a complete source of information on any particular company. Kalkine Media does not in any way endorse or recommend individuals, products or services that may be discussed on this site. Our publications are NOT a solicitation or recommendation to buy, sell or hold. We are neither licensed nor qualified to provide investment advice.
