


Crude oil prices are getting a push from the recent market development with the United States President now intervening in the oil price war. The United States President Donald Trump has urged the Russian counterpart to pull up a chair at the negotiation table, and market anticipates that the negotiation would remain fruitful.
Also Read: Oil Price War-A Trigger for Price Amidst Weak Demand; Stimulus Hope Upticks Oil
In his latest briefing to the local media, the United States President said that he is confident that both the oil giants Russia and Saudi Arabia will work it out, which seems to be pushing the crude oil up amidst of market turmoil and weaker demand due to the COVID-19 outbreak.
While the Brent crude oil futures recovered from its recent low of USD 21.65 a barrel (intraday low on 30 March 2020) to the present high of USD 26.28 (intraday high on 31 March 2020), some of the industry experts anticipate that oil era would be coming to an end, due to the ongoing development in the alternative energy space.
To Know More, Do Read: Rooftop Solar PVs Dodge the COVID-19 Impact as New Installations Set Records
The ongoing noise might or might not turn out to be true in due course, oil remains as the topmost source of energy generation and its product as a major transportation fuel, which keeps the crown of the most valuable asset, in terms of economic use, with the crude oil.
However, the ongoing development around the alternative energy space is supporting the price of stocks holding exposure to renewables, and in the status quo, such stocks are relatively outperforming the overall sectoral performance.
To Know More, Do Read: ASX-listed Energy Stocks Good For Diversifying Sectoral Risk?
Oil Recovery to Sustain Ahead?
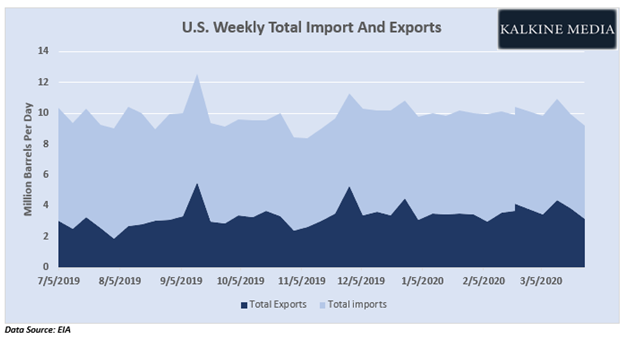
While the oil market is getting a push from the recent developments, the present oil trade figures from the United States, which is one of the top consumers across the globe, is depicting another picture, which does not bode well for oil prices.
The United States domestic crude oil production is averaging around a record high of 13.0 million barrels a day (YTD), with another week of steady production of 13.0 million barrels a day (for the week ended 27 March 2020), and the nation is able to uphold the run rate with slight variations.
The higher production, coupled with weaker import and exports against the previous week, suggests that the demand for oil across the local refineries cooled-off against the previous week.
Also Read: Crude Oil Takes A Breather As U.S. Refineries Increase Imports Amid Declining Product Inventory
The U.S. crude oil refinery inputs averaged 14.9 million barrels per day for the week ended 27 March 2020, down by 0.9 million barrels per day against previous week’s average. While the U.S. refineries imported less crude oil, they also operated at a lower operable capacity of 82.3 per cent for the same week, which in turn, further led to a fall in import and export.
For the week ended 27 March 2020, the net imports across the United States averaged at 6.0 million barrels per day, down by 0.1 million barrel per day against the previous week, while the net exports tumbled to stand at 3.1 million barrels per day, down by 0.7 million barrels per day against the previous week.
It looks like, the previous week’s higher import supported the oil product inventories across the nation, which reduced the demand for crude oil from refineries. As per the weekly estimates of the United States Energy Information Administration, the total motor gasoline inventories increased by 7.5 million barrels (for the week ended 27 March), along with an increase in both finished gasoline and blending components inventories.
The overall commercial petroleum inventory surged by 21.0 million barrels (for the week ended 27 March 2020).
While the oil products inventory across the United States rose considerably, a muted demand across the globe kept the inventory drawdown in check, which in turn, exerted pressure on crude oil prices, which slipped to mark a low of USD 21.65 on 30 March 2020.
Crude oil Future Projection On A Daily Chart
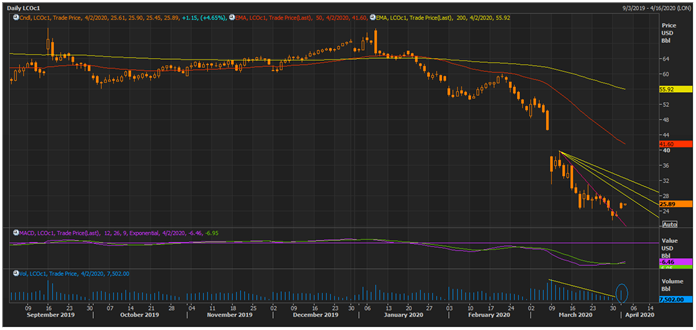
LCO Daily Chart (Source: Thomson Reuters)
On the daily chart, the crude oil is trading below the 200-day exponential moving average and 50-day exponential moving average with a negative crossover between them.
In the status quo, the crude oil is recovering slightly with a positive signal from the moving average convergence and divergence or MACD indicator. The commodity has recently breached its downward sloping trendline (pink line), with large volume, and till now is able to uphold the breakout above the short-term downward sloping trendline, which coupled with a previous decline in volume and price halt, suggest that bears are cooling off around these levels.
However, the Fibonacci fan, drawn over the short-term trendline is projecting multiple downward sloping (3 lines) trendlines, which should now act as immediate resistance levelsand should be closely monitored to reckon the future direction.
A break and sustenance above these multiple lines could interest bulls further, and failure to do so, would again represent the dominance of bears around the current price level.
The 50-day exponential moving average and 200-day exponential moving average are the ultimate resistance level, which the price should test and break to confirm a change in trend. Till then, the downtrend would be the major trend, and bulls should remain cautious around the above-mentioned leveland should wait for proper confirmation before diving into the market.
