


Caltex Australia Limited (ASX:CTX) takeover proposal is brewing in the market with bid and counterbid speculation coming into the picture. On 26 November 2019, Caltex drummed the unsolicited, conditional, confidential, non-binding and indicative proposal from Canada-based Alimentation Couche-Tard Inc.
Alimentation Couche-Tard Inc proposed to acquire all of Caltex’s share by way of a scheme of arrangement at a cash price of $34.50 a share with deductions concerning dividend declared by Caltex. This was the second time Alimentation Couche-Tard Inc eyed the Australian transportation fuel supplier with a revised indicative price of $34.50, up by over 7.80 per cent against its previously proposed indicative price of $32.00 a share.
Caltex again rejected the acquisition proposal at an indicative price of $34.50 over the Board’s assessment that the proposal from Alimentation Couche-Tard Inc still undervalues the company. However, at the moment Caltex has offered Alimentation Couche-Tard Inc some selected non-public information for further reassessment.
While a reassessment was proposed by Caltex, the speculation of a counter bid from Britain’s EG Group soared the company’s share above the proposed price from Alimentation Couche-Tard Inc, and currently, the share of the company is trading at $35.485 (as on 8 January 2020, 3:10 PM AEDT).
In an announcement today, Caltex cleared the dust around the speculation and notified, that post receiving the unsolicited, conditional, confidential, non-binding and indicative at a cash price of $34.50 from Alimentation Couche-Tard Inc, the company was approached by a number of parties, including EG Group.
However, the announcement from Caltex also suggested that while the concerned parties demonstrated interest in the company, Caltex has not received an acquisition proposal post the proposal from Alimentation Couche-Tard Inc. Albeit, some media sources cite that EG Group is consulting financial advisors for acquiring Caltex or some of its assets.
Be it or not be it, Caltex is flourishing over the bid and counter bid speculation, and the shares of the company are skyrocketing on the Australian Securities Exchange.
Stock Responds in Tandem
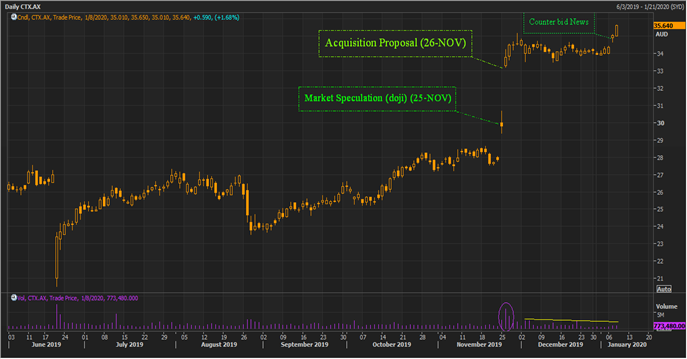
CTX Daily Chart (Source: Thomson Reuters)
On the daily chart, it could be seen that the stock price moved in tandem with the events/news related to the acquisition of Caltex. On 25 November 2019, the stock demonstrated a breakaway gap and ended the trading session with a Doji candle (which reflects that the market speculated and remained indecisive).
However, the next trading session, when Caltex announced the acquisition proposal, the bulls dominated the market, and the stock witnessed another breakaway gap, which marked the second consecutive day of gap-up opening.
Post 26 November 2019, the stock traded in positive territory and is currently surging on ASX.
What are Traders Expecting Ahead?
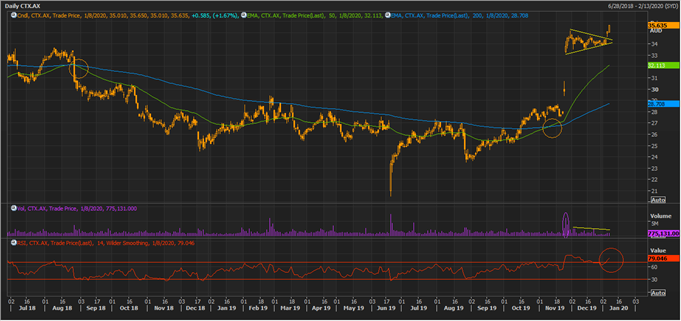
CTX Daily Chart (Source: Thomson Reuters
CTX is presently trading above the 200- and 50-day exponential moving average with a positive crossover between them, and post-viewing the historic price action, it could be inferred that the crossover between 200- and 50-day EMAs indicates coming trend with some confidence. The prices moved in a downtrend post witnessing a negative crossover of 200- and 50-day EMAs (August 2018), and investors could be expecting the same.
However, the volume trend suggests taking caution at the current market price amid weakening volume. The 14-day Relative Strength Index is hovering in the overbought zone and coupled with weak volume.
If the prices retrace over the near-term, the 50-day EMA could be a support followed by the 200-day EMA. The immediate support for the stock is at the downward sloping line of the symmetrical triangle on the daily chart.
The resistance and support levels generally reflect the psychology of the market, which tends to change in tandem with the market events, and investors should bring in their astute judgement before conjuring any position in the market.
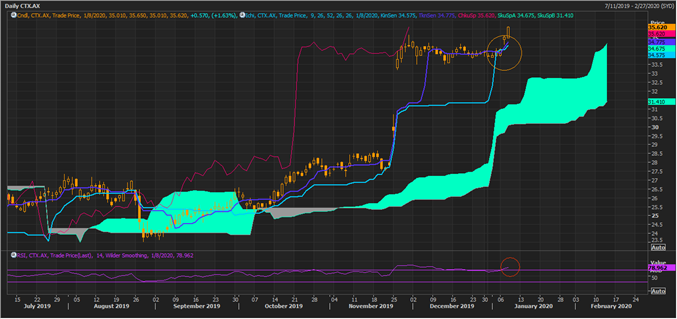
CTX Daily Chart (Ichimoku clouding) (Source: Thomson Reuters)
On applying the Ichimoku clouding technique on the daily chart, it could be noticed that CTX is trading above Span A (mean of the conversion line and the base line). The Span A is showing a large spread with Span B (mean of 52-period high and low), which further reflects that the current trend is an uptrend.
The Ichimoku is giving some strong indication with a positive crossover of the conversion line (mean of 9-period high and low) (dark blue) and the base line (mean of 26-period high and low) above Span A.
However, the 14-day RSI is aligning with the indication from Ichimoku, but is in the overbought zone; thus, investors should remain cautious at the current level. If the stock retraces back, which might or might not happen, the green cloud area could be the support level.
Disclaimer
This website is a service of Kalkine Media Pty. Ltd. A.C.N. 629 651 672. The website has been prepared for informational purposes only and is not intended to be used as a complete source of information on any particular company. Kalkine Media does not in any way endorse or recommend individuals, products or services that may be discussed on this site. Our publications are NOT a solicitation or recommendation to buy, sell or hold. We are neither licensed nor qualified to provide investment advice.
