


Lendlease Group (ASX:LLC) is an important global infrastructure and property group, with around 13K personnel across key geographies of Asia, Australia, Europe and the Americas. Some of its famous and important projects are the Athletesâ Village in London, September 11 Memorial & Museum in New York, Petronas Towers in Kuala Lumpur, Sydney Opera House, as well as stadiums and entertainment facilities, critical infrastructure across the schools, hospitals, residential communities, shopping centres and high rise buildings.
As per the media reports, Lendlease has shown a lot of interest in the future of data centres. It is anticipated that it will be infusing heavy investments along with other interested investors. Today, data centres have become an attractive investment asset class for investors around the globe. With its increasing usage, particularly in cloud storages, the demand for land across the world is increasing. Some of the important destinations for the data centres are Singapore, China, Malaysia, Japan and Australia. The increasing land prices are expected to pose a challenge to control the operational and maintenance cost of such data centres, however, huge dependence on data storage is also expected to provide further opportunities in this segment for the future.
H1 FY19 (ended on December 31, 2018) Key Highlights: The Directors of Lendlease Responsible Entity Limited, the Responsible Entity of Lendlease Trust, presented their H1 FY19 (ended on December 31, 2019) report.
Revenues (including other income) for the period was reported at $106.08 Mn as compared to $108.97 Mn in H1 FY18. Other expenses for the period was reported at ~$1.20 Mn as compared to $0.38 Mn in H1 FY18. The company reported finance revenues of $2.18 Mn in H1 FY19 as compared to $2.65 Mn in H1 FY18. The profit after tax for the period was reported at ~$106.40 Mn in H1 FY19 as compared to $111.25 Mn in H1 FY18. Basic/diluted earnings per unit for the period was reported at 18.65 cents per share as compared to 19.06 cents per share.
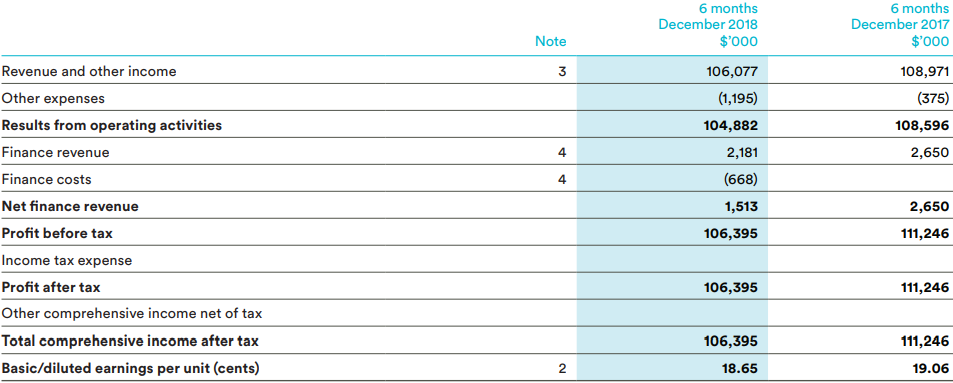
H1 FY19 P&L Statement (Source: Company Reports)
As per the companyâs balance sheet, under current assets, cash and cash equivalents on December 31, 2018, was reported at $9.33 Mn as compared to $6.95 Mn in H1 FY18. Its loans and receivables for the period were amounted to $227.58 Mn as compared to $138.14 Mn in H1 FY18. Under non-current assets, other financial assets for the period were reported at $1,080.28 Mn as compared to $1,144.42 Mn in H1 FY18. Under current liabilities, trade and other payables for the period were reported at $93K as compared to $132K in H1 FY18. Under shareholdersâ equity, issued capital, buyback reserve and retained earnings for the period were reported at $920.44 Mn, -$67.15 Mn and $463.79 Mn, respectively. Total equity attributable to the unitholders was reported at $1,317.08 Mn as compared to $1,244.54 Mn in H1 FY18.
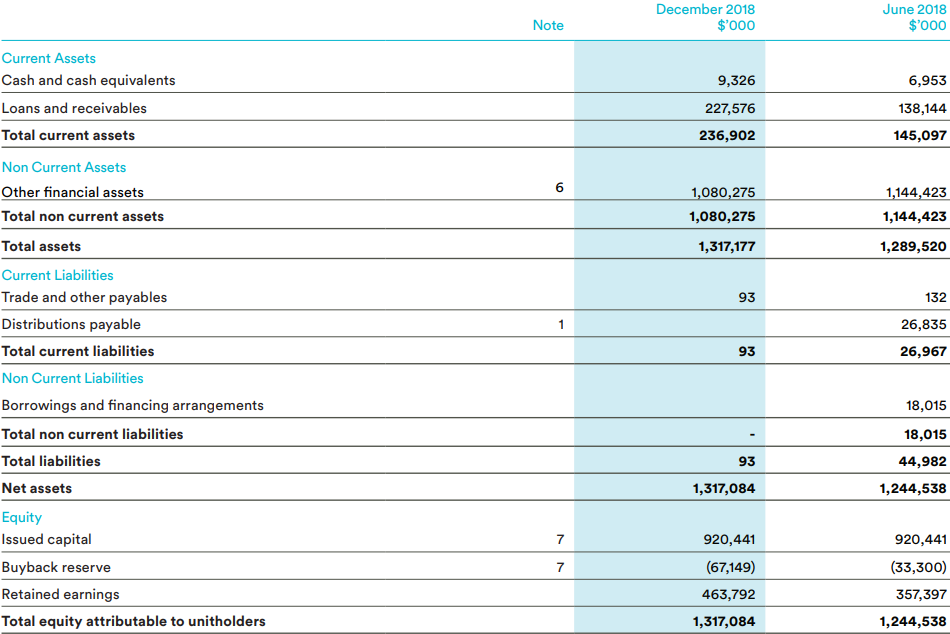
H1FY19 Balance Sheet (Source: Company Reports)
In the cash flow statement, the net cash provided by operating activities for the period was $27.42 Mn as compared to $27.36 Mn in H1 FY18. The cash receipts in the course of operations for the period were $1.76 Mn as compared to $44K in H1 FY18. The cash payments in the course of operations for the period were $991K as compared to $409K in H1 FY18. Interest received for the period was reported at $1.42 Mn as compared to $2.66 Mn in H1 FY18. Distributions received for the period stood at $25.23 as compared to $25.06 Mn in H1 FY18.
Its net cash provided by/(used in) investing activities for the period was reported at $144.62 Mn as compared to negative $49.60 Mn in H1 FY18. The disposal of investments for the period was amounted to $210.04 Mn.
Its net cash used in financing activities for the period stood at $169.66 Mn as compared to $25.18 Mn in H1FY18. The loan repayment to related party, distributions paid, loan to related party, payments for buyback of stapled securities (Distribution Reinvestment Plan) and payments for on market buyback of stapled securities for the period were reported at $18.01 Mn, $24.79 Mn, $90.96 Mn, $2.05 Mn and $33.85 Mn, respectively.
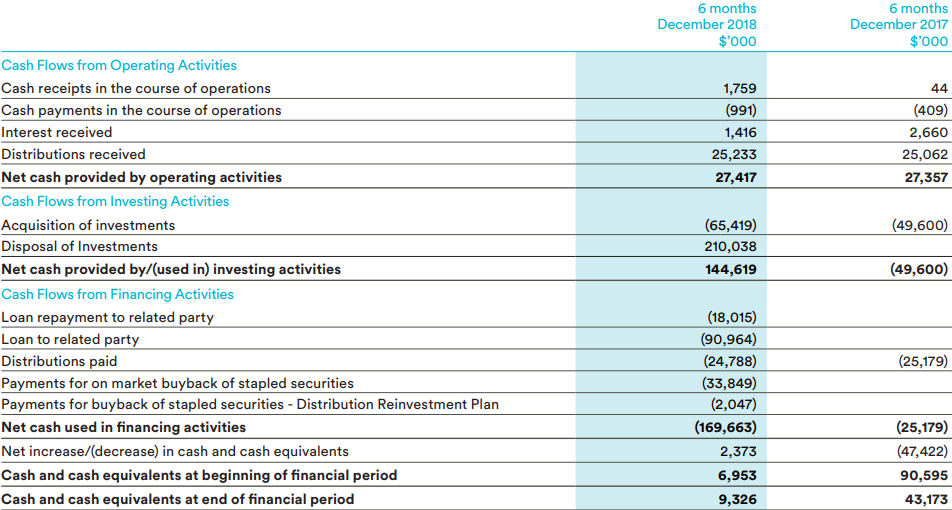
H1FY19 Cash Flow Statement (Source: Company Reports)
Lendlease Groupâs revenue for H1 FY19 was reported at $7,761.7 Mn, which was a decrease of 10.7% as compared to $8,691.2 Mn in H1 FY18. The groupâs profit after tax attributable to securityholders for the half year period was reported at $15.7 Mn, which was a decrease of 96.3% as compared to $425.6 Mn in H1 FY18. Under the groupâs building businesses, its present projects (urbanisation) in Asia and the Americas also contributed to the development segment earnings. During the period, several office buildings were completed at Singaporeâs Paya Lebar Quarter, along with securing new residential investment partnerships in the continent of America (North & South), through which interests were acquired in buildings at Southbank in Chicago and Clippership Wharf in Boston. Moreover, the enhancement in resales was observed in the Retirement Living business (RLB) portfolio. The groupâs service costs increased by 8% to $74.2 Mn, due to the investments in productivity and efficiency initiatives. The companyâs net finance costs increased by 14% to $52.6 Mn in half year period, majorly due to higher average net debt. Net debt for the company at the end of the period and the average cost of debt were reported at $2.3 Mn and 4.2%, respectively.
Outlook
The groupâs earnings expectations remained high with an increasing pipeline across both sector and geography in the project development and investment segments. The companyâs developmental pipeline is increasing significantly with a focus on urbanisation in targeted gateway cities. Lendlease Group also secured new projects in Europe, expanding its global outreach. It is expected that in the future, the greater contribution will come from the majority of urbanisation pipeline weighted towards international gateway cities. Under development pipeline, around 3k presold units and ~2K units for rent across 23 major apartment buildings are expected to be delivered between the second half of the financial year 2019 to the financial year 2021. Moreover, eight major commercial buildings are expected to be completed in between H2 FY19 to FY22.
On the stock information front, at market close on July 1, 2019, the stock of Lendlease Group was trading at a price of $13.300, up 2.308% during the dayâs trade, with a market capitalisation of ~$7.33 Bn. Its current PE multiple is at 19.580x, with the EPS of 0.664 AUD. Its annual dividend yield is recorded at 3.62%. Today, it reached dayâs high at $13.385 and dayâs low at $13.100, with a daily volume of 2,176,280. Its 52 weeks high price stands at $21.730 and 52 weeks low price stands at $11.030, with an average volume of 2,167,419 (yearly). Its absolute returns for the past one year, six months and three months are -34.14%, 10.83%, and 5.95%, respectively.
Disclaimer
This website is a service of Kalkine Media Pty. Ltd. A.C.N. 629 651 672. The website has been prepared for informational purposes only and is not intended to be used as a complete source of information on any particular company. Kalkine Media does not in any way endorse or recommend individuals, products or services that may be discussed on this site. Our publications are NOT a solicitation or recommendation to buy, sell or hold. We are neither licensed nor qualified to provide investment advice.
