


Macfarlane Group PLC
Macfarlane Group PLC (MACF) is a company based in the United Kingdom, which specialises in manufacturing and supplying of packaging materials. The company supplies self-adhesive labels, packaging products and warehousing facilities to FMCG clients. The company operates in various sectors such as retail, health, beauty, food, household goods, and aerospace. The company has a headcount of more than 900 people at 30 locations, mainly in the United Kingdom. The company has a customer base of more than 20,000 in the United Kingdom.
Financial highlights for H1 FY19
The revenue of the Macfarlane Group surged by 5.4 per cent to £107.5 million in the first half of 2019 despite weaker demand, as against £102.0 million in the first half of 2018. The companyâs Profit before tax surged by 8.7 per cent to £3.8 million in the first half of 2019 as against £3.5 million in the first half of 2018. As the e-commerce sector has picked up, the managementâs expectations for FY19 shall fall in line. The performance in 1H FY19 has been strong, and the company expects to have better margins in the remaining part of the year. The companyâs Packaging Distribution segment revenue stream rose by 4.4 per cent in the first half of 2019.
The turnover from existing clients saw weaker demand and prices were deflated. This was further offset by new acquisitions made in 2018 (Tyler packaging & Harrisons packaging). Recently, the company acquired Ecopac Limited (a UK based company). The companyâs operating profit from Packaging & Distribution was recorded at £4.5 million in H1 FY19, which was higher than the profit in the same period in 2018.
The companyâs manufacturing operations, particularly resealable labels, saw a strong surge in demand through new customer acquisitions, which resulted in 16 per cent higher revenues in H1 FY19 as against the same period in 2018. The companyâs operating profit for Manufacturing operations was recorded at £0.4 million in H1 FY19 more than the profit made in the same period in 2018.
The companyâs net debt was recorded at £15.0 million as at 30th June 2019, which was £1.8 million more than the net debt at 31st December 2018 (£13.2 million). The rise in net debt can be attributed to the acquisition of Ecopac, which resulted in a cash outflow of £2.8 million. The company is expected to be cash generative in H2 FY19.
The companyâs Diluted earnings per share surged by 9.9 per cent to 1.99 pence in H1 FY19 as against 1.81 pence in H1 FY18. The company has recommended an interim dividend of 0.69 pence per share payable on 10th October 2019 to the shareholders, which was 6.2 per cent higher than the last dividend pay-out.
The company rolled out new internet-based solutions to showcase the full range of products and services on offer, which will allow the customer greater accessibility and convenience.The company emphasis on reducing the cost incurred in continuing operations by property consolidation.
MACF Share price performance
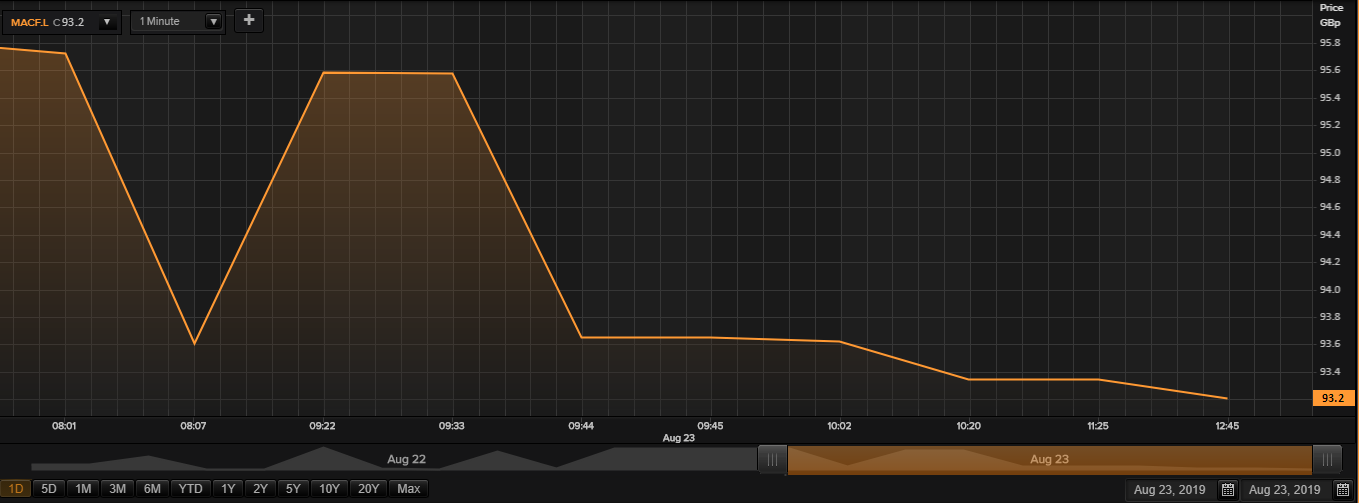
Daily Chart as at 23-August-19, before the market closed (Source: Thomson Reuters)
While writing (as on 23 August 2019, at 01:02 PM GMT), MACF shares were trading at GBX 93.2 per share; down by 2.91 per cent as compared to the previous day closing price level. At the time of writing, the companyâs M-cap (market capitalisation) was recorded at around £149.72 million.
In the last year, MACF shares have touched a new peak of GBX 109.50 (as on 14 May 2019) and a bottom price level of GBX 68.00 (as on 11 December 2018). At the current trading level, as quoted in the price chart, its shares were trading at 14.88 per cent lower than the 52-week high price mark and 37.05 per cent higher the 52-week low price mark.
While writing, the stockâs traded volume before the market close, was hovering around 78,995. Stock's average traded volume for 5 days was 76,423.20; 30 days- 85,481.50 and 90 days â 124,686.88. The beta of the companyâ s stock was 0.71, which means it was 29 per cent less volatile in comparison with the index considered as the benchmark.
At the time of writing, the shares of the company were faring above the 30-days and 200-days simple moving averages, which depicts an uptrend from the current trading levels.
In the past 3 months, MACF shares have delivered a negative return of 9.22 per cent. From the beginning of the year to till date, the companyâs stock surged by 34.27 per cent. In the past year, the companyâs stock has delivered a negative return of 5.88 per cent.Â
The stockâs RSI (Relative Strength Index) was recorded at 49.81, 55.16 and 60.56 for the 30-days, 14-days and 9-days respectively. Also, the stockâs RSI was recorded at 83.27 (3-day).
Â
Electrocomponents PLC
Electrocomponents Plc (ECM) is a global distributor of electronic and industrial products using multiple channels. The company offers over 500,000 products sourced from more than 2,500 suppliers. The company provide its products and services to more than 1 million customers and shipping over 50,000 parcels per day. The company is having its operations in 32 countries with an employee base of more than 6,600 professionals globally.
Recent News
On 26th July 2019, the Electrocomponents announced the private placement signing of worth US$200 million via new senior unsecured notes. The issue will be done in five tranches with a maturity period from 7 to 12 years. The notes will have a fixed rate of 3.11 per cent.
Financial Highlights â Financial Year 2019 (£, million)
In the financial year ending 31st March 2019, the companyâs reported revenue was up by 10.5 per cent to £1,884.4 million versus £1,705.3 million in the FY2018. The increased revenue was driven by market share gain in EMEA and the Americas region. The companyâs adjusted operating profit was up by 24.4 per cent to £220.3 million in FY2019 against £177.1 million in the FY2018. The companyâs reported operating profit was up by 16.5 per cent to £201 million in FY2019 against £172.6 million in the FY2018. The increase in operating profit was due to the improvement of results from all regions, and the companyâ Asia Pacific had become profitable. The companyâs PBT (Profit before tax) was up by 15.8 per cent to £195.2 million in FY2019 from £168.6 million in the FY2018. The companyâs Adjusted EPS was up by 30.3 per cent to 37 pence in FY2019 from 28.4 pence in FY2018. Due to ongoing expansion in the Americas, the Adjusted free cash flow declined to £84.5 million in FY2019.
The company had shown decent financial performance in the financial year 2019. There had been an increase in the Top-line performance for the period. The company had witnessed improvement in the market share from the EMEA and The Americas businesses.
The company provide products that provide the best customer experience, which resulted in the companyâs Net promotor score.  The companyâs proposed dividend for the full year has shown strong growth, which reflects confidence in the companyâs future. The company is looking forward to maintaining a long-term growth by closely monitoring its operating costs in an uncertain environment.
ECM Share price performance
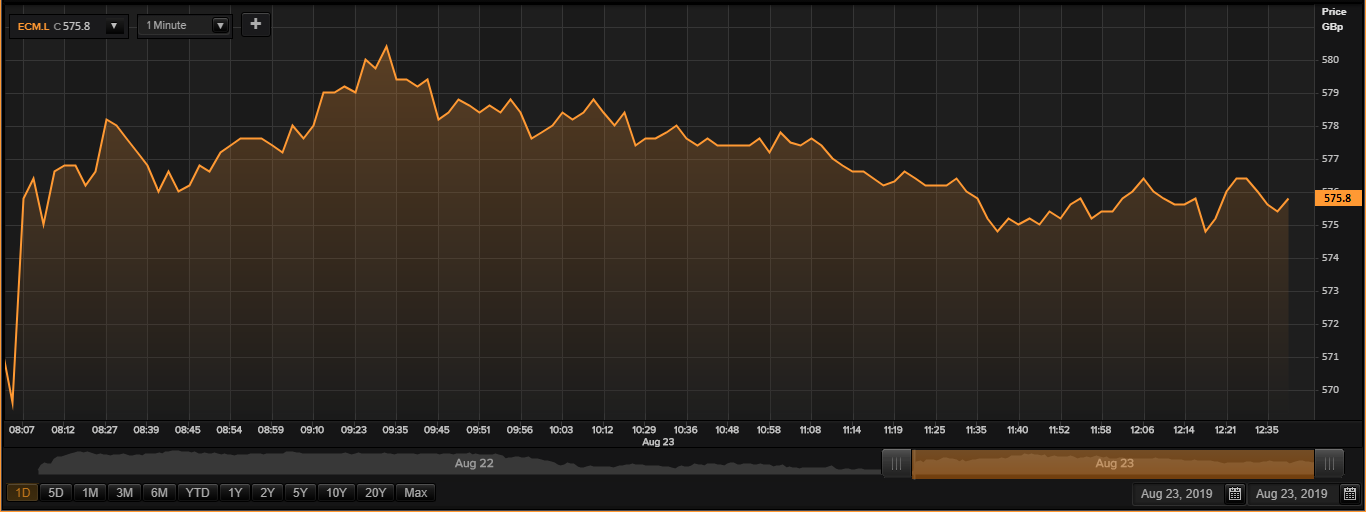
Daily Chart as at 23-August-19, before the market closed (Source: Thomson Reuters)
While writing (as on 23 August 2019, at 12:56 PM GMT), ECM shares were trading at GBX 575.8 per share; down by 0.73 per cent as compared to the previous day closing price level. At the time of writing, the companyâs M-cap (market capitalisation) was recorded at around £2.52 billion.
In the last year, ECM shares have touched a new peak of GBX 771.00 (as on 30 August 2018) and a bottom price level of GBX 478.40 (as on 03 January 2019). At the current trading level, as quoted in the price chart, its shares were trading at 25.31 per cent lower than the 52-week high price mark and 20.35 per cent higher the 52-week low price mark.
While writing, the stockâs traded volume before the market close, was hovering around 101,234. Stock's average traded volume for 5 days was 971,422.60; 30 days- 1,014,672.37 and 90 days â 949,560.89. The beta of the companyâ s stock was 1.26, which means it was 26 per cent more volatile in comparison with the index considered as the benchmark.
At the time of writing, the shares of the company were faring below the 30-days and 60-days simple moving averages, which depicts a downtrend from the current trading levels.
In the past 3 months, ECM shares have delivered a negative return of 11.19 per cent. From the beginning of the year to till date, the companyâs stock surged by 12.83 per cent. In the past year, the companyâs stock has delivered a negative return of 23.05 per cent.Â
The stockâs RSI (Relative Strength Index) was recorded at 46.02, 48.34 and 52.81 for the 30-days, 14-days and 9-days respectively, while the stockâs RSI was recorded at 66.51 (3-day).
