


Non-Standard Finance Plc
Non-Standard Finance Plc (NSF) has presence in the United-Kingdom's consumer finance non-standard domain. The company has 4 segregated divisions: Loans at Home, Central, Everyday Loans and Trusttwo. The Company exchanges Loans at Home Home Credit Division and gives home credit and cater to more than 90,000 clients. The Company's Everyday Loans gives credit to consumer without security. The Company's Trusttwo division operates in non-standard finance sector and is focussed on guaranteed loans.
NSF-Trading update
Solid top line expansion has been a key element of NSF's success point throughout the most recent four years as the company has effectively settled itself as a significant rival in every segments of the UK's non-standard finance domain: Lending based on branch, underwriter advances and home credit.
Generous venture has guaranteed that every business is well-set up to make the most of the noteworthy market opportunities that exist, yet the Board of NSF is likewise careful that after a considerable time period of economic development in the UK, the financial standpoint is presently more questionable than anytime over the most recent 10 years. All things considered; the company is finding a way to guarantee that every one of the Group's segments can deal with any future macroeconomic headwinds.
NSF-Share price performance
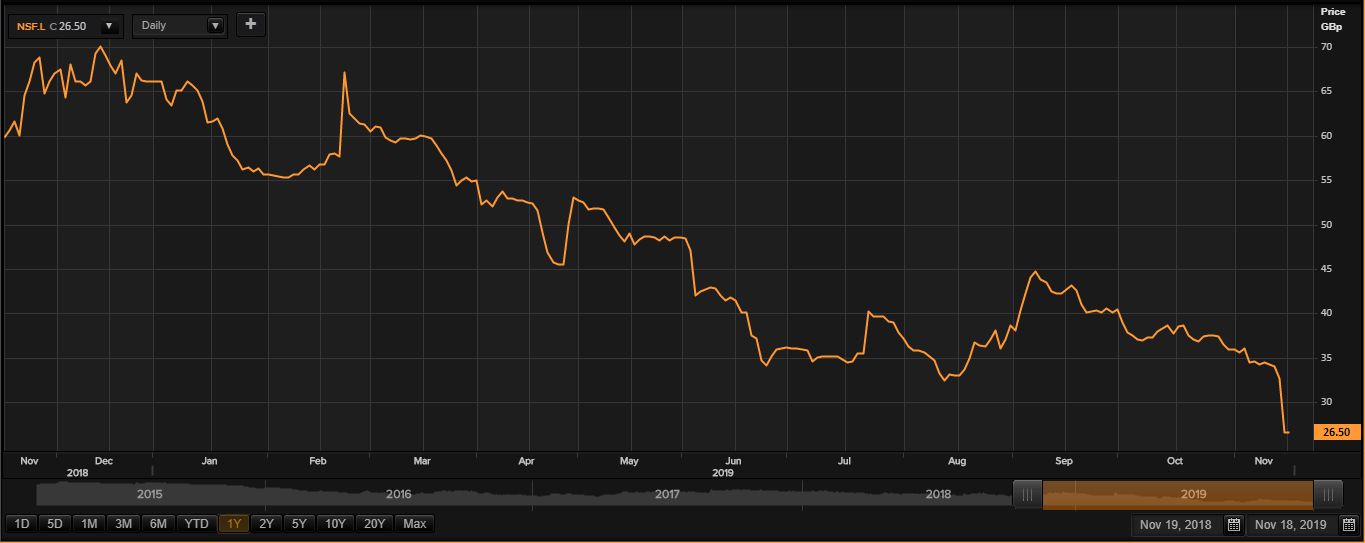
Daily Chart as on 18-November-19, before the market closed (Source: Thomson Reuters)
On 18th November 2019, while writing at 01:44 PM GMT, Non-Standard Finance Plc shares were clocking a current market price of GBX 26.50 per share; which was less by 0.37 per cent in comparison to the last traded price of the previous day. The companyâs market capitalisation was at £82.99 million at the time of writing.
On 27th November 2019, the shares of NSF have touched a new peak of GBX 70.15 and reached the new lowest price level of GBX 26.50 on 18th November 2018 in the last 52 weeks. The companyâs shares were trading at 62.22 per cent lower from the 52-week high price mark and currently hit the 52-week low price mark at the current trading level as can be seen in the price chart.
The stockâs traded volume was hovering around 133,397 at the time of writing before the market close. The companyâs 5-day stock's daily average traded volume was 628,815.80; 30 days daily average traded volume- 1,002,514.33- and 90-days daily average traded volume â 1,212,365.41. The volatility of the company has a gross dividend yield of 5.26 per cent.
The shares of the company have delivered a negative return of 19.39 per cent in the last quarter. The companyâs stock plunged by 59.70 per cent from start of the year to till date. The companyâs stock has given investors 54.14 per cent of a negative return in the last year.Â
Rolls-Royce Holdings Plc
Rolls-Royce Holdings Plc (RR) is a London, the United Kingdom-headquartered global engineering company with a focus on propulsion and power systems. It is one of the world's modern innovation company and looks to provide spotless, focused and aggressive answers for a wide scope of businesses.
RR-Financial Highlights (six months to 30 June 2019, £ million)
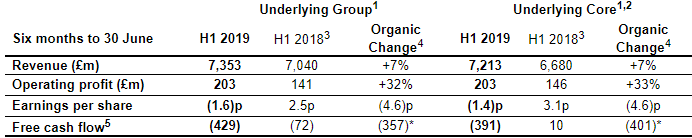
(Source: London Stock Exchange)
The companyâs underlying revenue was up by 7 per cent to £7,353 million in comparison to the corresponding period of the last year in the first half of 2019. The companyâs reported revenue increased by 5 per cent to £7,883 million in the first half of the fiscal year 2019. Underlying ITP Aero (up 23%), Civil Aerospace revenue (up 11%), Defence (up 2%), and Power Systems (up 6%), the companyâs revenue altogether had an upside. The companyâs underlying operating profit surged by 32 per cent from the previous year same period data. The companyâs underlying loss per share was 1.6 pence for the first half of fiscal year 2019 in contrast to the earnings per share of 2.5 pence in H1 FY18, while reported loss per share was around 48 pence per share in the first half of fiscal year 2019.
RR-Share price performance
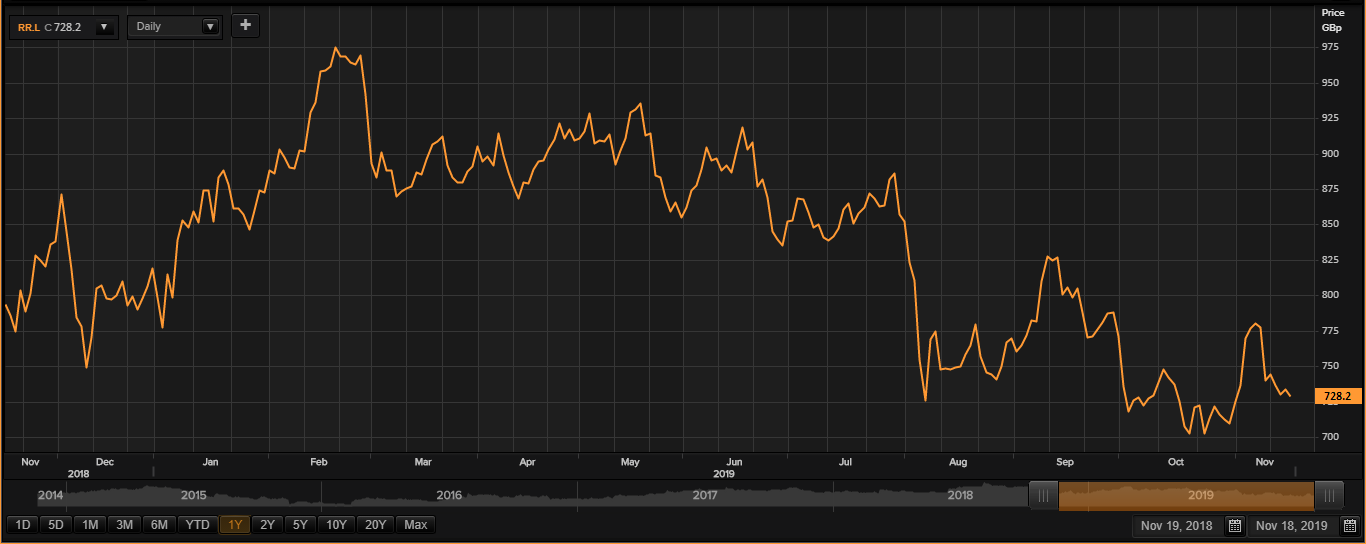
Daily Chart as on 18-November-19, before the market closed (Source: Thomson Reuters)
On 18th November 2019, while writing at 01:50 PM GMT, Rolls-Royce Holdings Plc shares were clocking a current market price of GBX 728.20 per share; which was less by 0.68 per cent in comparison to the last traded price of the previous day. The companyâs market capitalisation was at £14.16 billion at the time of writing.
On 28th February 2019, the shares of RR have touched a new peak of GBX 989.47 and reached the lowest price level of GBX 687.80 on 01st November 2019 in the last 52 weeks. The companyâs shares were trading at 26.40 per cent lower from the 52-week high price mark and 5.87 per cent higher than the 52-week low price mark at the current trading level as can be seen in the price chart.
The stockâs traded volume was hovering around 997,922 at the time of writing before the market close. The companyâs 5-day stock's daily average traded volume was 4,543,219.80; 30 days daily average traded volume- 5,618,341.50- and 90-days daily average traded volume â 4,478,426.39. The volatility of the companyâs stock was 11 per cent higher as compared with the index taken as the benchmark, as the beta of the companyâs stock was recorded at 1.11.
The shares of the company have delivered a negative return of 2.09 per cent in the last quarter. The companyâs stock plunged by 10.41 per cent from start of the year to till date. The companyâs stock has given investors 8.15 per cent of a negative return in the last year.Â
Royal Dutch Shell Plc
Hague, Netherlands-based Royal Dutch Shell Plc (RDSA) is an international group of energy and petrochemical company, which is involved in the exploring, producing, refining and marketing of oil and natural gas.
RDSA-Financial Highlights (Q3 FY2019 and 9M FY2019)
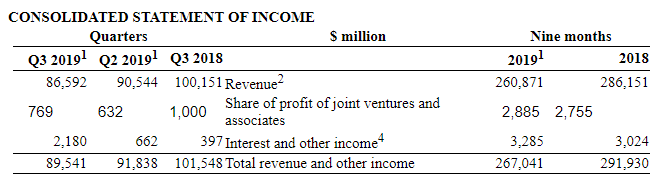
(Source: London Stock Exchange)
In the nine months of the financial year 2019 under consideration, the groupâs revenue stood at $260,871 million, which was 8.83% below compared to the $286,151 million recorded in 9M FY18, led by a dip in the revenue from Integrated Gas, Downstream, and Corporate segments during the period. The basic earnings per share for 9M FY19 was $1.84 versus $2.14 in 9M FY18. For the nine months of 2019, the dividend per share stood at $1.41 and remained the same from the corresponding period of the last year, while in Q3 FY19 the dividend per share was $0.47. Cash flow from operating activities surged by 3% to $31,913 million in 9M FY19 against the same period in 2018.
During the fourth quarter of 2019, the group's Integrated gas production is expected to be between 920 and 970 thousand barrels of oil per day, and LNG liquefaction volumes are expected to be between 8.8 and 9.4 mt. Upstream Production is expected to be in between 2,650 and 2,800 thousand barrels of oil equivalent, and Refinery availability would be in between 87% to 92%, respectively. Oil Products sales volumes are anticipated to be in the range of 6,650 â 7,050 thousand boe/d. Chemicals manufacturing plant availability is estimated to be in the range of 81% â 86%. For the full year 2019, the cash capital expenditure is anticipated to be around the lower end of the $24 â $29 billion range. The company earnings demonstrate the toughness of the market-facing businesses and their capability to capitalise on market conditions, with robust trading.
RDSA-Share price performance
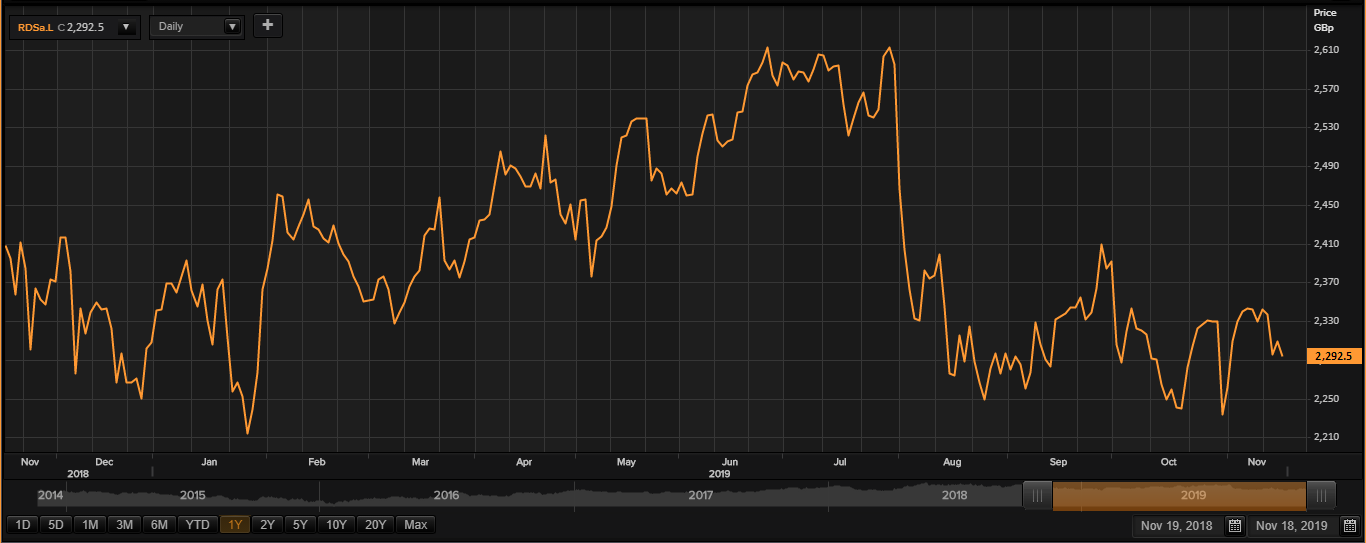
Daily Chart as on 18-November-19, before the market closed (Source: Thomson Reuters)
On 18th November 2019, while writing at 01:55 PM GMT, Royal Dutch Shell Plc shares were clocking a current market price of GBX 2,292.50 per share; which was more by 3.75 per cent in comparison to the last traded price of the previous day. The companyâs market capitalisation was at £182.50 billion at the time of writing.
On 7th May 2019, the shares of RDSA have touched a new peak of GBX 2,811.38 and reached the lowest price level of GBX 2,209.50 on 28th January 2019 in the last 52 weeks. The companyâs shares were trading at 18.45 per cent lower from the 52-week high price mark and 3.75 per cent higher the 52-week low price mark at the current trading level as can be seen in the price chart.
The stockâs traded volume was hovering around 10,935,901at the time of writing before the market close. The companyâs 5-day stock's daily average traded volume was 5,454,840.80; 30 days daily average traded volume- 5,679,610.77- and 90-days daily average traded volume â 6,190,595.40. The volatility of the companyâs stock was 35 per cent higher as compared with the index taken as the benchmark, as the beta of the companyâs stock was recorded at 1.35 with a dividend yield of 6.41 per cent.
The shares of the company have delivered a positive return of 1.45 per cent in the last quarter. The companyâs stock surged by 0.02 per cent from start of the year to till date. The companyâs stock has given investors 3.89 per cent of a negative return in the last year.Â
