


John Laing Group PLC
John Laing Group Plc (JLG) is an investor, operator and manager of infrastructure assets, primarily for the public sector. The group offers asset management services to both the primary and secondary investment portfolios through its subsidiary JLCM (John Laing Capital Management). John Laing offers its services to the companies operating in health, justice and emergency services, defence, regeneration, other accommodation, international accommodation, local authority development, roads, rail, street lighting, waste and utilities, and renewable energy sectors. The company operates in Europe, the UK, Asia Pacific and North America.
Recent developments
John Laing Group Plc entered new geography and made its presence felt in the Latin American region by investing £62 million acquiring 30 per cent of the Ruta del Cacao road project (Colombia). The project is about the development of road connecting main cities in the North-Eastern region. The acquisition of the project is slated to be completed soon. The tenure of the project is 25 years with an option to extend for four more years. The company is supposed to build, design and operate, including maintenance. The project will evolve over the period based on PPP (Public Private Partnership) model.
Financial Highlights for H1 FY19 (£, million)
The company was able to generate IMS revenue of £20 million from asset management and investment advisory in H1 FY19 as against £9 million in H1 FY18. Besides, the company generated PMS revenue of £3 million from the provision of services to companies under service agreements. The companyâs Profit before taxation (PBT) was recorded at £35 million in H1 FY19 as against £175 million in H1 FY18; this plunge can be attributed to the reduction in the portfolio. The company incurred finance costs of £4 million in H1 FY19 as against £5 million in H1 FY18. The lowering of finance costs can be attributed to lesser investments during the period. The companyâs net assets were recorded at £1,599 million at 30th June 2019. The company had cash balances of £136 million at 30th June 2019. The company declared an interim dividend of 1.84 pence per share which would be payable in October 2019.
JLG Share price performance
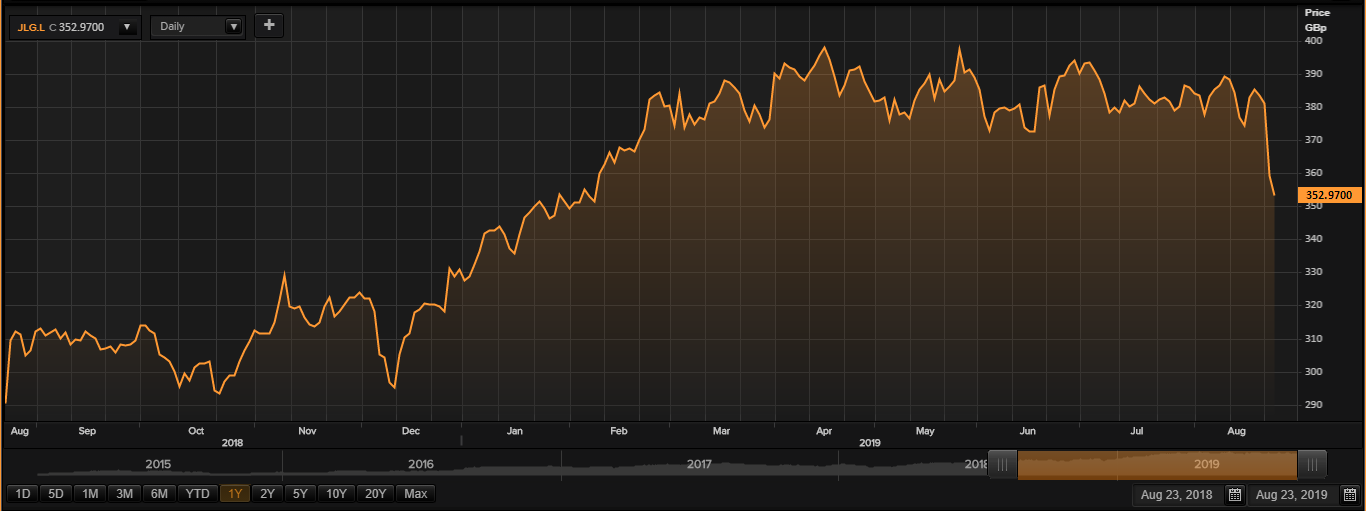
Daily Chart as at 23-August-19, before the market close (Source: Thomson Reuters)
While writing (as on 23 August 2019, at 12:21 PM GMT), JLG shares were trading at GBX 352.97 per share; down by 1.73 per cent as compared to the previous day closing price level. At the time of writing, the companyâs M-cap (market capitalisation) was recorded at around £1.75 billion.
In the last year, JLG shares have touched a new peak of GBX 399.80 (as on 31 May 2019) and a bottom price level of GBX 288.54 (as on 15 October 2018). At the current trading level, as quoted in the price chart, its shares were trading at 11.71 per cent lower than the 52-week high price mark and 22.32 per cent higher the 52-week low price mark.
While writing, the stockâs traded volume before the market close, was hovering around 553,441. Stock's average traded volume for 5 days was 1,155,080.00; 30 days- 510,212.13 and 90 days â 508,006.30. The beta as on date of the companyâ s stock was 0.60, which means it was less volatile in comparison with the index considered as the benchmark.
At the time of writing, the shares of the company were faring below the 30-days and 60-days simple moving averages, which depicts a downtrend from the current trading levels.
In the past 3 months, JLG shares have delivered a negative return of 6.60 per cent. From the beginning of the year to till date, the companyâs stock surged by 9.33 per cent. In the past year, the companyâs stock has delivered a positive return of 23.80 per cent.Â
The stockâs RSI (Relative Strength Index) was recorded at 39.41, 31.02 and 25.43 for the 30-days, 14-days and 9-days respectively, while, the stockâs RSI was recorded at 9.26 (3-day).
Columbus Energy Resources PLC
Columbus Energy Resources plc (CERP) is into exploration and development of oil and gas. The company operates assets in various geographies such as the US, Spain, Trinidad, UK and Tobago. The company was earlier known as LGO Energy Plc. The company also holds exploration interests and leases.
Recent News
The company is working on a pilot project called COâ with another company called Predator. The idea is to transform, revive and optimise the deeper reservoirs. This pilot project shall transform the oil and gas industry by transforming the isolated deeper reservoirs.
Financial highlights for FY18
The companyâs revenue surged by 58 per cent to £7.57 million in FY18 as against £4.79 million in FY17. The companyâs gross profit was recorded at £1.45 million in FY18 as against £0.08 million in FY17. The company had cash balances of £1.71 million in FY18 as against £4.0 million in FY17. The companyâs debt was recorded at £0.67 million in FY18 as against £1.21 million in FY17.
CERP Share price performance
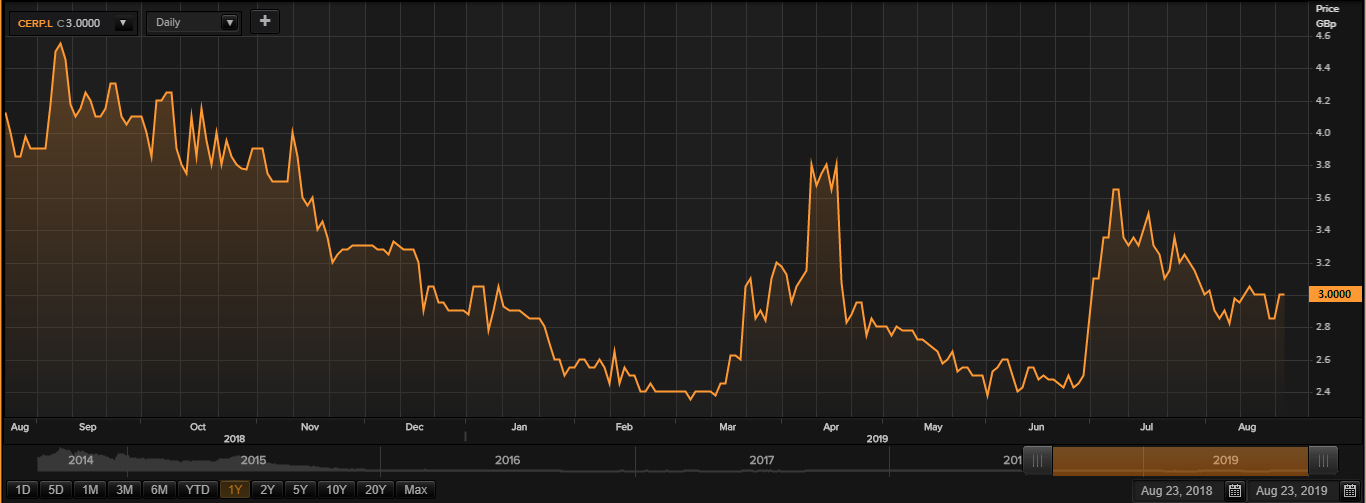
Daily Chart as at 23-August-19, before the market closed (Source: Thomson Reuters)
While writing (as on 23 August 2019, at 12:16 PM GMT), CERP shares were trading at GBX 3 per share; which remained flat as compared to the previous day closing price level. At the time of writing, the companyâs M-cap (market capitalisation) was recorded at around £24.67 million.
In the last year, CERP shares have touched a new peak of GBX 4.78 (as on 07 September 2018) and a bottom price level of GBX 2.25 (as on 03 June 2019). At the current trading level, as quoted in the price chart, its shares were trading at 37.23 per cent lower than the 52-week high price mark and 33.33 per cent higher than the 52-week low price mark.
While writing, the stockâs traded volume before the market close, was hovering around 449,349. Stock's average traded volume for 5 days was 717,890.20; 30 days- 1,285,785.73 and 90 days â 1,978,352.84. The beta of the companyâ s stock as on date was negatively correlated in comparison with the index considered as the benchmark.
At the time of writing, the shares of the company were faring above the 60-days and 200-days simple moving averages, which depicts an uptrend from the current trading levels.
In the past 3 months, CERP shares have delivered a positive return of 13.21 per cent. From the beginning of the year to till date, the companyâs stock surged by 3.45 per cent. In the past year, the companyâs stock has delivered a negative return of 27.27 per cent.Â
The stockâs RSI (Relative Strength Index) was recorded at 50.92, 49.94 and 51.36 for the 30-days, 14-days and 9-days respectively, while, the stockâs RSI was recorded at 67.77 (3-day).
James Fisher and Sons plc
James Fisher and Sons plc (FSJ) is based in the United Kingdom, a service sector firm with a focus in the marine industry. In addition, the company supplies special engineering equipment to the (Nuclear) energy sector. The company has all equipments and services on offer, from tankships to rescue products, from oil tankers to engineering solutions.
Recent developments
The company recently acquired 60 per cent stake in air diving service provider known as SM Continental for a total cash consideration of £7.5m. This move shall cater to the offshore oil sector in Brazil.
Financial highlights for FY18
The companyâs revenue surged by 13 per cent to £561.5 million in FY18 as against £499.3 million in FY17. The companyâs underlying operating profit surged by 15 per cent to £ 62.1 million in FY18 as against £ 54.1 million in FY17. The companyâs underlying operating margin surged by 20 basis points to 11 per cent in FY18 as against 10.8 per cent in FY17. The companyâs underlying profit before tax surged by 15 per cent to £ 56.1 million in FY18 as against £48.6 million in FY17. The companyâs underlying diluted EPS surged by 14 per cent to 89.5 pence in FY18 as against 78.7 pence in FY17. The companyâs Statutory profit before tax surged by 17 per cent to £55.4 million in FY18 as against £47.3 million in FY17. The companyâs statutory diluted EPS surged by 16 per cent to 88.9 pence in FY18 as against 76.9 pence in FY17. The companyâs total dividend per share surged by 10 per cent to 31.6 pence per share in FY18 as against 28.7 pence per share in FY17.
FSJ Share price performance
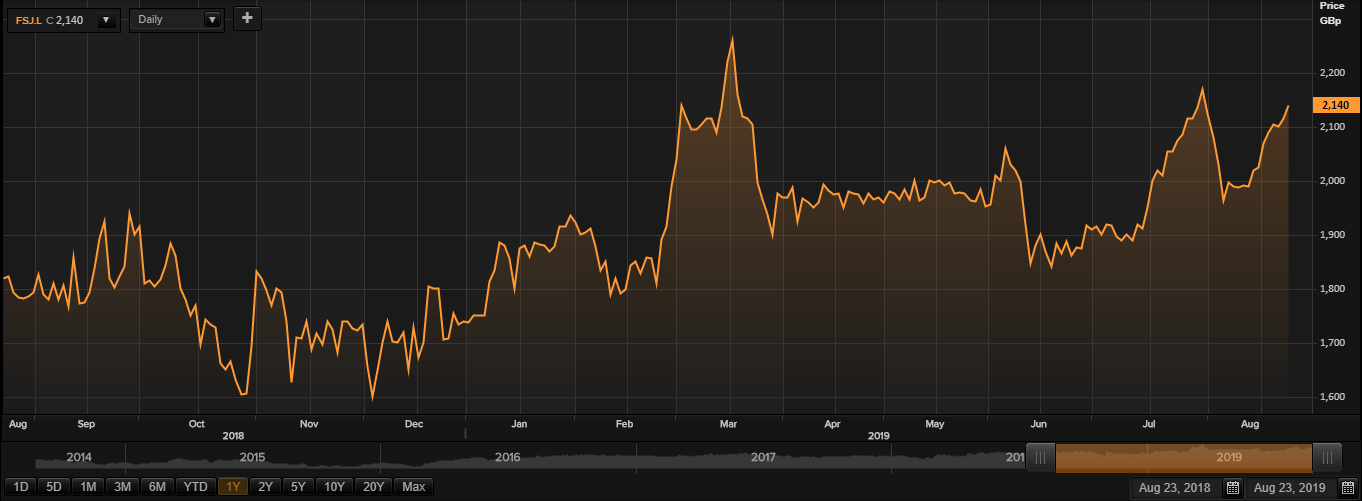
Daily Chart as at 23-August-19, before the market close (Source: Thomson Reuters)
While writing (as on 23 August 2019, at 12:11 PM GMT), FSJ shares were trading at GBX 2,140 per share; up by 1.18 per cent as compared to the previous day closing price level. At the time of writing, the companyâs M-cap (market capitalisation) was recorded around £1.05 billion.
In the last year, FSJ shares have touched a new peak of GBX 2,280.00 (as on 19 March 2019) and a bottom price level of GBX 1,568.00 (as on 15 November 2018). At the current trading level, as quoted in the price chart, its shares were trading at 6.14 per cent lower than the 52-week high price mark and 36.47 per cent higher the 52-week low price mark.
While writing, the stockâs traded volume before the market close was hovering around 2,524. Stock's average traded volume for 5 days was 11,606.80; 30 days- 13,699.63 and 90 days â 18,478.80. The beta of the companyâ s stock as on date was 0.47, which means it was less volatile in comparison with the index considered as the benchmark.
At the time of writing, the shares of the company were faring above the 30-days and 60-days simple moving averages, which depicts an uptrend from the current trading levels.
In the past 3 months, FSJ shares have delivered a positive return of 7.03 per cent. From the beginning of the year to till date, the companyâs stock surged by 21.97 per cent. In the past year, the companyâs stock has delivered a positive return of 16.21 per cent.Â
The stockâs RSI (Relative Strength Index) was recorded at 58.84, 64.04 and 69.12 for the 30-days, 14-days and 9-days respectively, while the stockâs RSI was recorded at 89.72 (3-day).
