


_06_19_2026_12_34_15_139937.jpg)


FirstGroup PLC
FirstGroup PLC (Identifier: FGP) is a West Sussex, United Kingdom-headquartered provider of transport services in the UK and North America, which seeks to meet the transport needs of universities, school boards, state and local authorities, and national governments. The group has a breadth of expertise across different regulatory and contractual environments as it has a broad footprint in the UK and North America, giving it an experience of two of the most developed markets in the world, where it designs and operates hundreds of networks in partnership with the communities. The operations of the group are differentiated in five operating segments, namely First Student, First Transit, Greyhound, First Bus and First Rail.
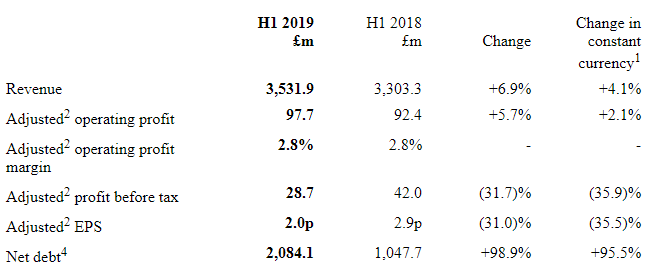
Financial Highlights (H1 FY 2019, in £m)
(Source: London Stock Exchange)
While the company has undertaken a programme to improve the performance of the group, the effects of the same are yet to materialise. Moreover, it has to face an increase in insurance costs for its North American businesses due to the further deterioration in the US motor claims environment, impacting the statutory results of the group.
Total revenue of the group expanded by 4.1 per cent in constant currency, with the Road division increased by 1.8 per cent and decent growth recorded in First Student, First Transit and First Rail divisions. In H1 FY2019, total revenue accelerated by 6.9 per cent to £3,531.9 million. Reflecting fewer First Student operating days and poorer UK summer weather, adjusted operating profit excluding the effect of transitioning to IFRS 16 decreased by 7.3%, while adjusted operating profit grew by 2.1% in constant currency basis to £97.7 million (H1 2018: £92.4 million). Reflecting the restructuring and reorganisation costs of £15.4 million, North American self-insurance reserve charge of £59.3 million and the Greyhound impairment charge of £124.4 million, statutory operating loss was £118.1 million (H1 2018: profit of £46.3 million). Due to the first-time adoption of IFRS 16 and dollar-denominated financing costs, adjusted profit before tax and adjusted EPS decreased by 35.9% and 35.5% to £28.7 million and 2 pence per share, respectively. Statutory loss before tax was reported at £187.1 million and loss per share rose to 14.3 pence from a loss of 0.6 pence in the prior year. Adjusted cash outflow was £78.0 million (H1 2018: inflow of £50.6 million), and net debt increased in the period to £2,084.1 million (H1 2018: £1,047.7 million).
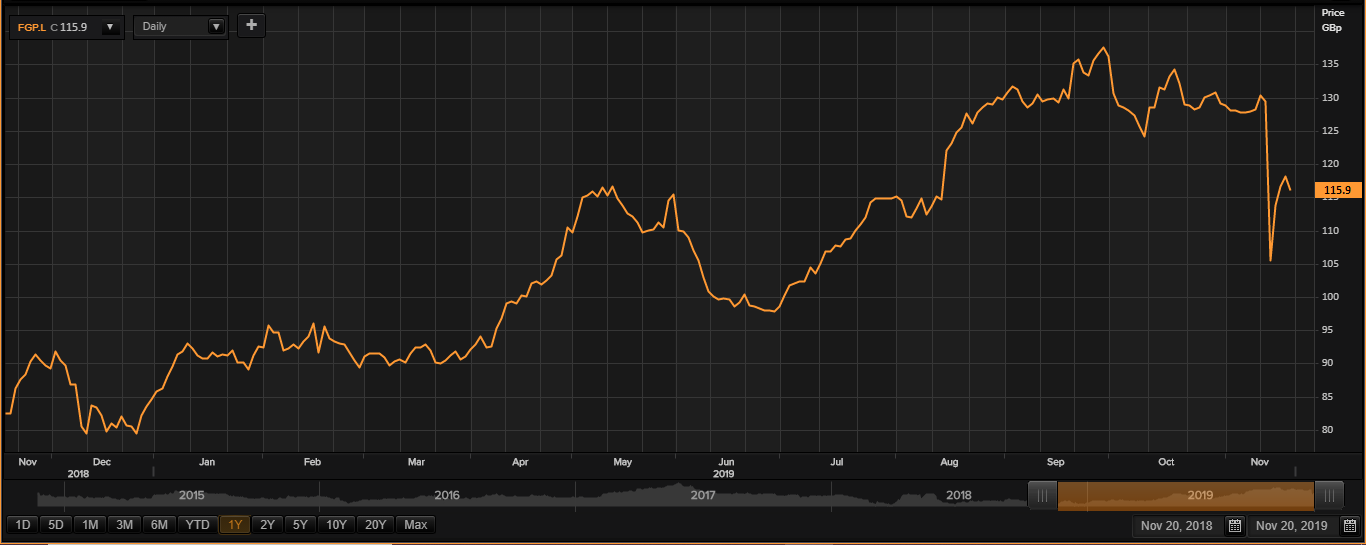
FGP - Share price performance
(Source: Thomson Reuters)
While writing (as on 20th November 2019, at 01:38 PM GMT), FGP shares were trading at GBX 115.90 per share; plunged by 1.77 per cent as compared to the previous day closing price level. The companyâs total market capitalisation was approximately £1.44 billion.
FGP shares have made a high of GBX 138.80 (as on 1st October 2019) and a low of GBX 78.30 (as on 27th December 2018) in the past one year. At the current price point, as quoted in the price chart, the companyâs shares were trading 16.49 per cent below the 52-week high price point and 48.02 per cent above the 52-week low price point.
At the time of writing, the stockâs volume before the market close, stood at 636,861. Stock's average daily traded volume for 5 days was 5,123,445.60; 30 days - 2,357,299.50 and 90 days â 1,830,489.66. The companyâs stock beta (5Y monthly) was 1.28, which makes it more volatile as against the benchmark index.
The average daily traded volume for 5 days surged by 117.34 per cent as against 30 days average daily traded volume. At the time of writing, the shares of the company were trading below the 30-days and 60-days SMA.
In the past 1 month, FGP shares have delivered a negative return of 12.01 per cent. Also, on a YTD (Year-to-Date) time interval, the stock surged by approximately 41.49 per cent and was down by 5.37 per cent in the last three months.
Share's RSI (Relative Strength Index) for the 30-days, 14-days and 9-days was recorded at 43.54, 40.37 and 40.55 respectively. Also, the stockâs 3-days RSI was recorded at 50.12.
Tesco PLC
Tesco PLC (Identifier: TSCO) is a United Kingdom-based retail company and is one of the largest retailers of consumer goods in the world, serving millions of customers every week through stores as well as online space. While the group also offers insurance and retail banking services, it mainly operates as a retailer of grocery products. The operations of the group are differentiated in two operating segments, namely Retail and Tesco Bank. The Retail division is further divided into three geographical segments: UK & ROI, Asia and Central Europe.
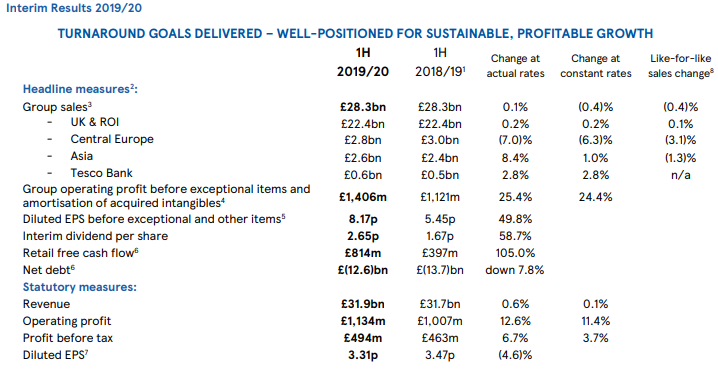
TSCO - Financial Highlights for H1 FY20
(Source: Companyâs website)
The group has continuously improved the quality and value of service & offers and is well-positioned to deliver strong, sustainable returns. The company is placing an increasing focus on growth in free cash flow and continues to strengthen its balance sheet. The company announced its interim results for the half-year ended 31st August 2019 on 2nd October 2019. The company reported a total group sale of GBP 28.3 billion in H1 2020. There was an outstanding performance from the Asian business where the revenue growth was at 8.4 per cent based on actual rates. The company reported a group operating profit at GBP 1.40 billion in the first half of the financial year 2020, a 25.4 per cent growth based on actual rates. The company reported a diluted earnings per share value of GBX 8.17 per share in the first half of the financial year 2020 (before exceptional and other items) as compared to GBX 5.45 in the first half of the financial year 2019. In reflection of this outstanding performance during the first half of the year, the company declared an Interim dividend of GBX 2.65 per share in the first half of the financial year 2020, a 58.7 per cent increase from the first half of the financial year 2019 interim dividend of GBX 1.67 per share.
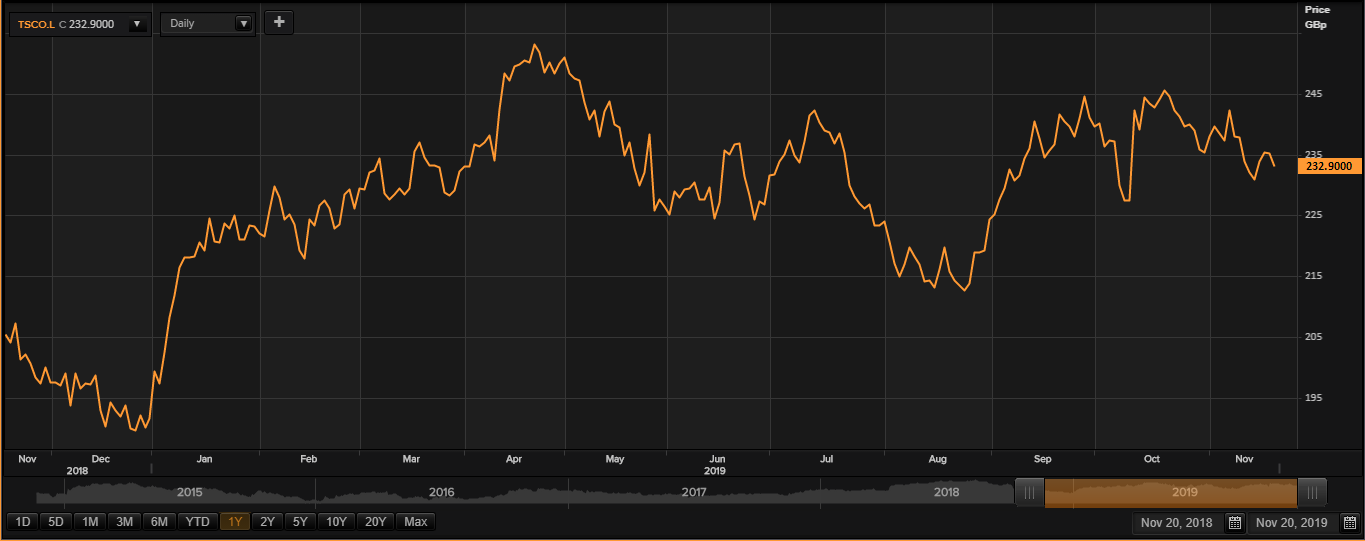
TSCO - Share price performance
(Source: Thomson Reuters)
While writing (as on 20th November 2019, at 01:44 PM GMT), Tesco shares were trading at GBX 232.90 per share; plunged by 0.93 per cent as compared to the previous day closing price level. The companyâs total market capitalisation was approximately £23.08 billion.
Tesco shares have made a high of GBX 254.10 (as on 23rd April 2019) and a low of GBX 187.05 (as on 28th December 2018) in the past one year. At the current price point, as quoted in the price chart, the companyâs shares were trading 8.34 per cent below the 52-week high price point and 24.51 per cent above the 52-week low price point.
At the time of writing, the stockâs volume before the market close, stood at 4,546,407. Stock's average daily traded volume for 5 days was 14,506,028.00; 30 days- 20,350,225.23 and 90 days â 20,572,917.09. The companyâs stock beta (5Y monthly) was 1.04.
The average daily traded volume for 5 days plunged by 28.72 per cent as against 30 days average daily traded volume. At the time of writing, the shares of the company were trading below the 30-days and 60-days SMA.
In the past 1 month, Tesco shares have delivered a negative return of 3.65 per cent. Also, on a YTD (Year-to-Date) time interval, the stock surged by approximately 23.67 per cent and was up by 7.01 per cent in the last three months.
Share's RSI (Relative Strength Index) for the 30-days, 14-days and 9-days was recorded at 49.68, 47.02 and 46.31 respectively. Also, the stockâs 3-days RSI was recorded at 59.31.
