


Source: Poring Studio, Shutterstock
Summary
- GlaxoSmithKline PLC (LON:GSK) gained 4.56% percent in the last trading session.
- The stock soared almost ~16.64 percent in the last eight weeks, the price has broken out of its falling channel pattern.
- GSK’s prices are trading above a horizontal trend line support on the daily chart and getting support from the 50-period SMA.
- GSK stock prices are trading in a falling wedge formation on the weekly chart and the MACD generated a fresh positive crossover signal.
GlaxoSmithKline PLC (LON: GSK) share price has witnessed a sharp recovery from the low of GBX 1,190.80 made on 26 February 2021 to the recent high of GBX 1,389 tested on 15 April 2021, a gain of ~16.64 percent in the last eight weeks. On Thursday, the stock prices closed at GBX 1,348.40 level, up by 4.56%, and remained as one of the top gainers in the FTSE 100 index. The stock outperformed some of its peers, such as AstraZeneca Plc. (LON: AZN) up 1.77%, and Faron Pharmaceuticals Oy. (LON: FARN) up 1.47%.
GSK stock price breaks out of a falling channel pattern on the daily chart

Source: EODHD/Others, Thomson Reuters; Analysis: Kalkine Group
The stock has broken out its descending channel pattern at GBX 1,320 level on 16 April 2021 on the daily chart. After consolidating for more than 11 months in a channel pattern, the price registered a decisive breakout that suggests a change in the trend from sideways to upward. The Stock has also broken a horizontal trendline resistance level (black color horizontal line in the above chart) at GBX 1,322.18 level. The volume has also gone up in the last trading session, which indicates higher participation.
Besides, the price is trading above its 50-period SMA, acting as a crucial support zone below the upper band of the channel pattern. The momentum oscillator RSI (14-period) is trading at ~65 levels, indicating a positive trend for the stock. MACD is also showing a positive crossover and trading above the centerline further indicates an upside direction for the stock. The Parabolic SAR indicator is trading above the current market prices and acting as a short-term resistance zone for stock.
GSK on a weekly chart
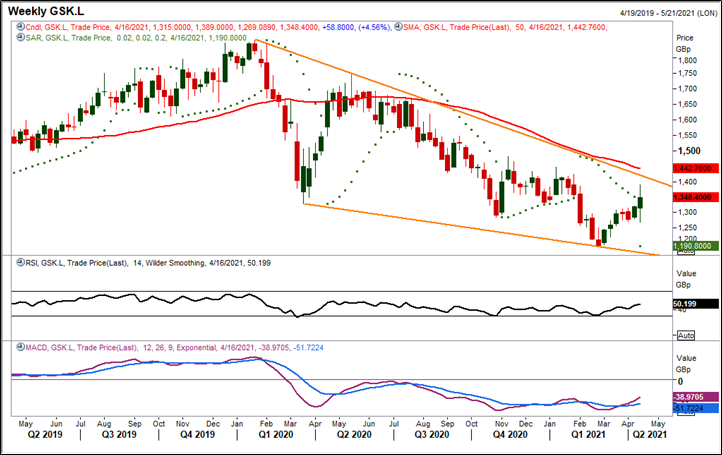
Source: EODHD/Others, Thomson Reuters; Analysis: Kalkine Group
The stock prices are trading in a falling wedge pattern for the last one year and currently, prices are approaching the upper band of the pattern. The price has fallen almost ~40 percent from its high of GBX 1,669.80 made on 20 July 2020 to the low of a GBX 1,190.80 made on 26 February 2021.
The stock price is well placed below its 50-period SMA, acting as the important resistance at the upper end. However, the momentum oscillator RSI (14-period) is trading at ~50 levels, indicating a possibility of further upside movement in the stock towards the resistance zone. The prices are trading above the Parabolic SAR indicator, acting as an immediate support zone for the stock near the lower band of the wedge pattern. Recently MACD was showing a positive crossover indicating that the bulls are back in action. The major resistance level for the stock is at GBX 1,410.70 level.
Based on the above chart analysis and technical outlook, the GlaxoSmithKline PLC. price seems to be in the recovery phase. Currently, the stock prices are approaching the key resistance zone. The chart pattern suggests that there might be more action expected in GSK if the price breaks the important resistance levels in the coming weeks.
