


_10_04_2024_16_38_50_427275.jpg)

The oil markets are one of the most data-sensitive in the world. When traders react to one economic release, causing crude prices to move several percentage points in a few minutes, it is not that they are reacting irrationally to the news, but because the data in the release actually moves the supply-demand equation. So, if you're an investor, a commodity trader, or a financial analyst seeking to answer the question of why prices do what they do, you need to know which indicators are significant.
How Macroeconomic Data Connects to Oil Pricing
Crude oil is an industrial product. It is priced in real-time according to the current supply and demand dynamics on the global market, which are influenced by market expectations with respect to where supply and demand are headed. As major economies grow, so do industrial production, transportation usage and energy consumption. As growth slows down, the demand expectations become mellow and the prices adapt.
Any individual who was watching crude oil price live in the moment of a huge data release, a Chinese GDP miss, a surprise Federal Reserve statement, or a U.S. employment surprise will understand how quickly markets can reprice. Brent and WTI can move 2-3% in minutes when there is any significant deviation from consensus. This responsiveness indicates the degree of incorporation of the expectations of future demand into current prices.
Oil pricing is always influenced by four general types of indicators:
- Provide information on inventory, production and drilling activity
- GDP growth, industrial output and consumption data by sector.
- Financial indicators - the U.S. dollar index and monetary policy signals
- Data relating to policy and trade - OPEC+ production decisions and big import flows
The relative importance of these varies according to what forces are prevailing in the market at any particular time.

Supply-Side Indicators
Supply data indicates the quantity of crude oil that is really coming on. Inventories are building up and prices are under pressure when production is greater than consumption. As supply decreases and demand remains the same, prices increase - although this correlation is seldom as pure as the theory may indicate.
EIA Weekly Petroleum Status Report
This weekly data release by the U.S. Energy Information Administration is the most closely watched short-term data release in crude oil markets, published every Wednesday. The report is analyzed as soon as it's released. It covers:
- U.S. commercial crude oil inventories
- Refinery utilization rates
- Changes in stockpiles of gasoline and distillate
- Crude imports and exports volumes and values.
- Forecasts of domestic crude production
The market's initial response is based on the difference between the reported numbers and analyst expectations, not the actual numbers. Unplanned inventory accumulation puts down pressure on prices; unplanned inventory depletions tend to put up pressure on prices. The market is positioned to the release and has already priced in consensus.
OPEC+ Decisions and the U.S. Rig Count
The global supply baseline is established by OPEC+ by coordinating their output agreements. Markets will look at the declaration of quotas but also at what actually happens regarding compliance with the quotas, as is often the case between member countries. If cuts are sincere, they reduce supply conditions; if they are overproduction, they slacken supply conditions. The Baker Hughes weekly rig count provides a forward-looking element - when rigs increase in the U.S., it is a sign producers are optimistic about future prices, which is an indicator of medium-term supply growth and not necessarily a reflection of production levels.
Demand-Side Indicators
Demand analysis is inherently more complex than supply because: If inventories can be physically counted, the demand is spread out among industries, regions and consumption patterns that are not easily tracked in real time. There are several indicators that give signals, but each has its drawbacks that are important to be aware of in practice.
GDP Growth Rates
GDP data provides the most comprehensive measure of economic activity available. A rise in oil demand forecasts because of the improving growth of large economies such as the U.S., China, the EU and India. Historically, contractions and/or sharp downward revisions come first, then comes demand destruction. This is a good indication of the close relationship between the economy and energy consumption on a large scale, with the oil demand destruction in 2020 caused by the global recession of that year amounting to approximately 9 million bpd .
Manufacturing PMI
The Purchasing Managers' Index for the manufacturing sector measures activity in the industrial sector every month, and a PMI above 50 indicates that the sector is growing, while below 50 indicates decline. Manufacturing data from China, the U.S. and Germany is especially influential in oil market sentiment, as manufacturing activities are energy-intensive. Surprising declines in China's PMI below 50 have been correlated with significant crude price action in subsequent days.
Chinese Economic Data and Import Volumes
According to IEA estimates, China is the biggest importer of crude oil in the world, accounting for around 16% of the world's oil demand . One of the hottest demand-side indicators in the market is monthly Chinese customs data on crude imports. Wider economic indicators like investment in fixed assets and industrial output provide context, and underlying economic activity can seep through to energy use.
Industrial Production Figures
Unlike PMI, industrial production is an actual output measure of manufacturing, mining and utilities. It's one of the more difficult data points to ignore, as a prolonged slowdown in major economies has historically led to a decrease in energy demand and a downward pressure on crude prices.
Seasonal and Transportation Demand
Demand for oil is predictable, following a normal seasonal pattern: U.S. summer driving consumption; Northern Hemisphere winter heating; and aviation fuel consumption linked to travel activity. The recovery of passenger traffic in 2024 took the demand for jet fuel over its pre-pandemic peak in 2025, albeit with a lag due to efficiency improvements in the aircraft fleet. When looking at short-term inventory data, it is important to understand that seasonal patterns help to frame the data.
Financial Indicators: The Dollar and Monetary Policy

In addition to the basics of supply and demand, there are two financial factors that have a constant and structural impact on crude oil pricing.
The U.S. Dollar Index (DXY)
The price of crude oil is determined internationally in U.S. dollars, establishing a direct link between the U.S. dollar and oil prices internationally. A higher dollar makes the cost of crude more expensive for all buyers who do not have dollars, and this slows the international demand and puts downward pressure on prices. The effect is reversed with a weaker dollar. The Bank for International Settlements has been able to confirm this negative relationship in the longer term, and also that it is known to lose its force in periods of intense financial stress or where there are supply shocks that prevail at the same time.
The Federal Reserve's Interest Rate Policy
The Fed sets rates for oil on several fronts simultaneously. Generally, higher rates drive up the dollar and dampen growth - both of which curb expectations for demand. When rate cuts occur, it eases conditions and can help raise commodity prices, which helps support growth prospects. The effect is more likely to be a medium-term consideration, and not the immediate trading signal, as it tends to play out over weeks and quarters in the form of growth expectations changing.
Key Indicators: Reference Overview
Below is a summary of the major indicators discussed, when they're released and their general impact on oil price sentiment. The impact is always context-specific, and can vary widely depending on the overall market environment.
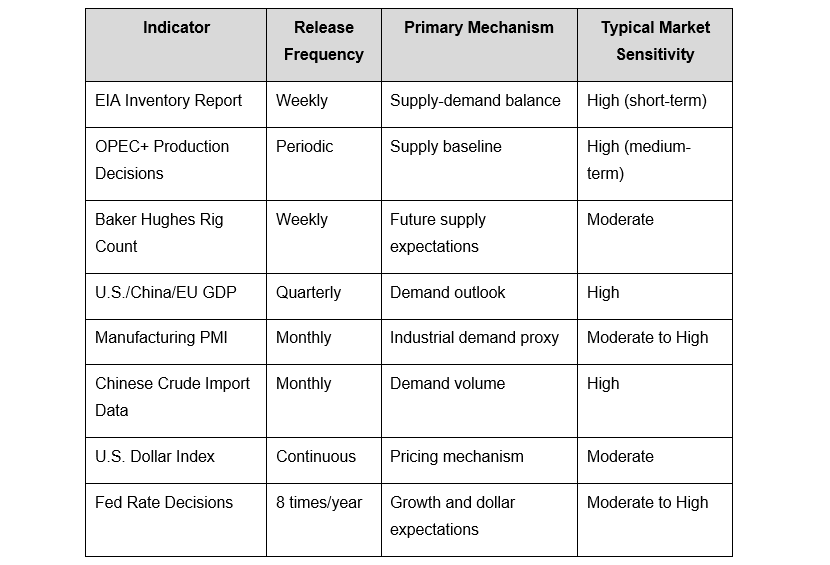
None of the indicators here is independent and works alone. The impact on pricing at any point in time is greatly dependent on the risks that the market is focusing on at the moment and what positions are currently held.
The above information is for general informational purposes only and should not be considered financial or investment advice. Oil price movements are influenced by multiple dynamic factors, and past or typical market reactions may not indicate future outcomes. Readers should conduct their own research or seek professional advice before making any investment decision .
How Multiple Indicators Interact
On their own, no single indicator is reliable enough to determine the direction of the oil prices. Markets are constantly processing many signals at once and the importance of each one depends on the circumstances. On the back of a supply disruption (geopolitical tensions - like the current one surrounding Iran, or OPEC+ output changes, or infrastructure constraints) supply-side data tends to get the focus. But demand indicators tend to take the center stage during economic uncertainty.
When considering the combined effect of these signals, there are several dynamics to keep in mind:
- It's the divergence from consensus expectations that leads to an immediate reaction, not the actual number.
- Lagged effects are frequently experienced; the poor PMI numbers don't always immediately translate into demand weakness.
- Markets ignore short-term data in the face of a strong medium-term fundamental trend.
- Geopolitical developments can easily take the place of economic signals and occur in a blink of an eye.
- Initial data releases are often revised and sometimes meaningfully in subsequent months.
- Reactions to single reports can be exaggerated or suppressed depending on investor sentiment and market positioning, without regard to the facts of the report.
It is such dynamics that create some difficult issues in crude price analysis, even when information is on time and complete.
Known Limitations of Indicator-Based Analysis
Using economic indicators as a tool to monitor the market is a way of providing a framework for understanding the market, not a guarantee of price movement. A few limitations should be noted explicitly:
- GDP and industrial production data are subject to large reporting delays, sometimes even weeks after the data period.
- OPEC+ conformity data is based partly on estimates from secondary sources and not verified production figures.
- The PMI surveys reflect business sentiment and intentions rather than actual levels of industrial activity - survey results are sometimes different from actual industrial activity.
- During large financial crises or when oil is subject to supply side shocks, the correlation between the DXY and oil breaks down.
- Demand forecasts, both IEA and EIA, are continuously updated following the initial release and at times by amounts that change the macro narrative.
The usefulness of economic data monitoring is not diminished by these constraints but rather these indicate the appropriate scope for the monitoring. Indicators are just there to explain market behavior, not to take the uncertainty out of the equation.
Conclusion
The price of oil is the result of a continuous process of supply conditions, demand expectations, financial dynamics, and policy signals being integrated. Each indicator listed here plays a part in the pricing mechanism in real and measurable, if not predictable, ways. Learning about these signals, when they are signaled and what they usually mean for the market is actually valuable information for anyone involved in the energy markets or commodity-linked assets.
Disclaimer
This article is intended for informational and educational purposes only. It is not intended as financial, investment or trading advice or as a recommendation to engage in, or refrain from, any financial instrument or commodity. Crude oil and other commodity markets involve a high level of risk, including the possibility of loss of capital. Economic indicators are not a reliable indicator of market conditions and previous correlations with macroeconomic indicators and oil prices cannot be assumed to continue in the future. Investors should consult a financial adviser before taking any investment or trading action.
The content has been authored in collaboration with our guest contributor, Kydyk Nazarii.
