


Summary
- Bitcoin prices have gained considerable momentum recently, making its position as the digital safe haven stronger.
- Since the having day on 12 May 2020, the currency has been on a bull run post showing a brief consolidation.
- Now, the currency is showing some strong bullish sentiment and charts setup.
- Be it a consolidation breakout on the daily chart or the weekly three-bar stick pattern of an outside bar followed by an inside bar and a high breach; the charts are pointing that bulls are now taking charge and leading the front.
- What are chartists looking at?
Bitcoin prices have swiftly climbed the ladder with the digital gold surging to a new 12-month high of USD 12,024.0 ( intraday high on 10 August 2020) after breaking a consolidation phase, which marked its presence post the halving day.
To Know More, Do Read: Bitcoin Caught Between Higher Acceptance and Lower Mining Reward Since the Halving Day
In the recent past, the commodity has breached the upper line of the consolidation range, inviting bulls to lead the charge.
Bitcoin on Charts
- Bitcoin on a Daily Chart
BTC Daily Chart (Source: EODHD/Others Eikon Thomson Reuters)
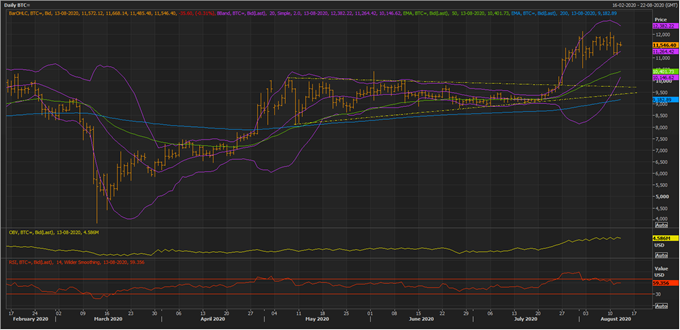
On following the daily chart, it could be seen that the stock broke out of the consolidation range and rose to test the +2 Standard Deviation of the 20-day simple Bollinger band.
- The currency is currently moving in an uptrend with prices trading above the 200- and 50-day exponential moving average, suggesting that bulls are currently dominating the front.
- At present, the bitcoin is testing the mean value of the 20-day simple Bollinger band which should act as immediate support for the price.
- Moreover, the consolidation break has been backed by a large increase in volume, which could be inferred from the increasing slope of the On Balance Volume indicator.
- Furthermore, the 14-day RSI has already taken a correction from the overbought zone and is now sloping upwards, which coupled with some other signals (to be discussed further) is indicating emerging bullish sentiments.
BTC Daily Chart (Source: EODHD/Others Eikon Thomson Reuters)
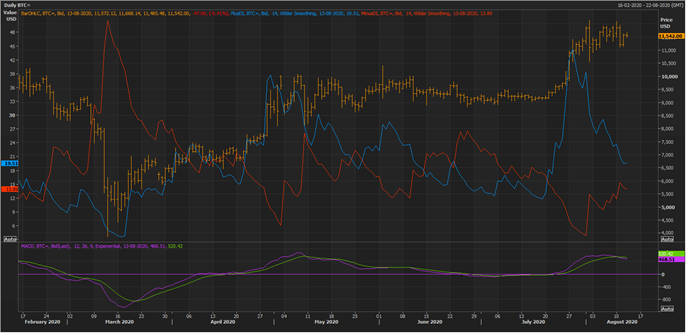
On further applying directional signals and MACD on the daily chart, it could be seen that the plus directional index (or DI) is trading above the minus DI, reflecting that bullish sentiments are currently prevailing, and the primary trend is an uptrend.
- However, the 12,24, 9 MACD is showing a slight negative indication with the signal line touching the MACD line from above, which might be an early sign of a slight correction.
BTC Daily Chart (Source: EODHD/Others Eikon Thomson Reuters)
The Ichimoku clouding technique is showing some strong positive signals with the conversion line ( or the mean value of 9-day high and low) crossing the base line (dark blue) or the mean value of 26-day high and low from below and above Span A – mean value of the conversion line and the base line.
- Moreover, Span A is trading above Span B – which is the mean value of 52-day high and low, reflecting that the primary trend is an uptrend.
- The primary or immediate support for the currency is at the base line, followed by a decisive sky blue cloud zone.
Furthermore, the 14-day RSI is moving in tandem with the price action with a slight correction in RSI from the overbought zone.
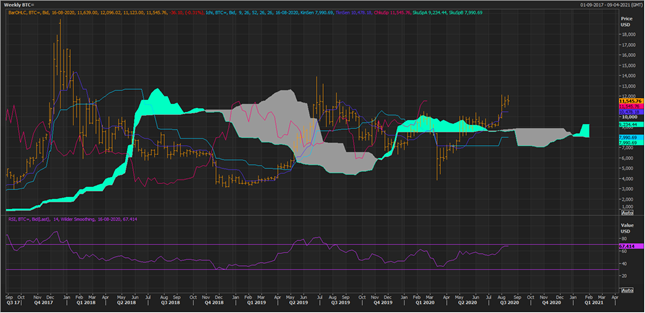
- Bitcoin on a Weekly Chart
BTC Weekly Chart (Source: EODHD/Others Eikon Thomson Reuters)
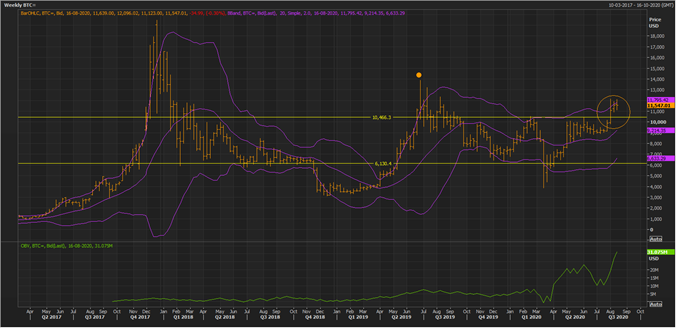
The weekly chart is showing some interesting development with the currency breaching its long-term horizontal resistance of USD 10,466.
- Apart from a breach of long-term resistance, the currency has also attempted a volatility breakout with prices beaching the +2 Standard Deviation of the 20-week simple Bollinger band while managing to sustain the same.
- Moreover, the 20-week simple Bollinger band is perfectly fitting the long-term consolidation range of USD 6,100.00 to USD 10,466.00, and a breakout above the range along with the long-term resistance could seed long-term bullish sentiments in the currency.
- Furthermore, it should be noticed that an outside bar emerged on the daily chart to breach the long-term resistance, followed by an inside bar, which is considered as a very bullish setup in some of the technical analysis journals and books.
- Also, the high of the inside bar has been breached on the weekly chart, reflecting on rising bullish interest.
- The On Balance Volume is also sloping upwards with the breakout, suggesting that the breakout and the bar stick patten (encircled) (outside + Inside + high breach) is supported with high volumes.
BTC Weekly Chart (Source: EODHD/Others Eikon Thomson Reuters)
On applying the Ichimoku technique on the weekly chart, it could be seen that the conversion line and the base line are showing a positive crossover above Span A and the interpretation of the setup is same as was on the daily chart.
However, the 14-week RSI is moving up and reaching the overbought zone, reflecting on the possibility of profit booking activities once bullish sentiments emerge more strongly.
In a nutshell, the bitcoin seems firmly rooted and bullish sentiments are prevailing on the daily and weekly timeframe. However, one thing which would be worth considering in the future would be the ability of bulls to take the currency above its previous peak high (marked with a dot on the weekly chart), and once the commodity breaches, confirms, and sustain the previous high, it could seed bullish sentiments for the long-term.
