
 AUS
AUS
 NZ
NZ
 UK
UK
 CA
CA
 USA
USA
 IND
IND



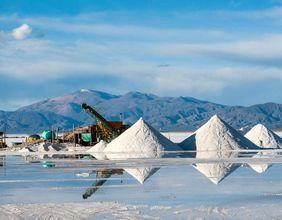




Energy is one of the largest sectors in Canada, governing a major share of 13.2 per cent in the S&P/TSX Composite Index.
Its sectoral index, the S&P/TSX Capped Energy, comprises 13 large players and holds an average market cap of C$ 12.25 billion. Amid the debilitating pandemic, it managed to grow about 55 per cent year-to-date (YTD).
As the economy heals from the COVID-19 impact, let us take a look at some of the top players of energy sector in Canada.
- Canadian Natural Resources Limited (TSX:CNQ)
Canadian Natural Resources is based out of Calgary, Canada, and is one of the largest energy sector players in the country. It commands a market cap of C$ 54 billion at the moment.
It has oil and gas operations concentrated in western Canada, along with North Sea and offshore Africa. Its production stood at 1.246 million barrels of oil equivalent per day in the first quarter of 2021.
- Suncor Energy Inc. (TSX:SU)
Suncor Energy’s upstream oil and gas operations include bitumen, synthetic crude oil, while its refining operations supplement the company’s total revenues. It has a capacity of processing about 466,000 barrels per day.
The company’s stock traded at C$ 30.98 on the TSX as on June 15, 2021, clocking a month-over-month (MoM) gain of about three per cent.

Copyright © 2021 Kalkine Media
- Cenovus Energy Inc. (TSX:CVE)
Cenovus Energy holds refining operations in the US, and production units of natural gas liquids, crude oil, etc based in Alberta. Its market cap stands around C$ 25 billion, as per TSX data.
Cenovus stock closed at C$ 12.48 on June 15, with a price-to-book ratio of 1.09 and a 0.575 per cent dividend yield.
- Imperial Oil Limited (TSX:IMO)
Imperial Oil focuses on upstream oil production, petroleum refining and marketing these petroleum products. It currently operates three refineries, with a processing capacity of about 421 million barrels of oil equivalent per day.
Imperial Oil’s net income rose significantly on a year-over-year basis to touch C$ 392 million in the first quarter ending March 31, 2021.
- Tourmaline Oil Corp (TSX:TOU)
Tourmaline Oil is a Calgary-based oil and natural gas exploration company, holding a 9.8 billion market capitalization. Its operations are concentrated in western Canada and the sedimentary basin.
Tourmaline Oil saw its stocks grow about four per cent in the last 30 days, as per the closing price of C$ 32.86 on June 15, 2021.
- ARC Resources Ltd. (TSX:ARX)
ARC Resources is a C$ 7.26-billion market cap company that is involved in the exploration, development, and production of natural gas products. As on June 15, it reflected a 30-day average trading volume of 3.08 million shares.
The oil and gas player held a dividend yield of 2.43 per cent, a P/E ratio of 18.60 and a P/B ratio of 2.463, as per TMX.
- Whitecap Resources Inc. (TSX:WCP)
The C$ 4.07-billion market cap company is one of the largest energy enterprises operating in the country, with its operations centered in western Canada.
Generating most of its revenues from its crude oil products, the company produced about 95,800 BOE/D, which is nearly 5 per cent higher than its initial guidance.
Whitecap reported revenues of C$ 448 million from its petroleum and natural gas production in the quarter ending March 21, 2021.
- Crescent Point Energy Corp. (TSX:CPG)
Crescent Point Energy, a Calgary-based oil and gas company, reportedly held reserves of 411 million BOE by the end of 2020.
With a market cap of C$ 3.3 billion as on June 15, the energy enterprise’s average 30-day trading volume touched 4.26 million.
Crescent Point Energy’s cash flow generation rose considerably in the first quarter of 2021, which helped the company reduce its net debt by about C$ 135 million.
- Parex Resources Inc. (TSX:PXT)
Parex Resources is said to have oil exploration and development operations in the western Canadian Sedimentary Basin, while its focus remains in Colombia.
It earns revenues from the sale of its oil products to participants in South and North America.
Parex held a market cap of C$ 2.815 billion on June 15, with about 128 million outstanding shares. The company offered earnings per share of C$ 1.43, and a P/E ratio of 15.70, as per TMX.
- PrairieSky Royalty Ltd (TSX:PSK)
PrairieSky Royalty, which collects royalty revenue from natural gas and petroleum development, owns sub-surface mineral rights on several royalty properties located in western Canada.
It recorded a C$ 3.2 billion market capitalization on June 15, with a P/E ratio of 77.10 and a P/B ratio of 1.36. The oil and gas sector company offers a 1.78 per cent return on equity.
If you are looking for more than just the top 10 Canadian energy players, here is a list of all the companies posted under this category on the TSX:
|
Name |
|
Market Cap (in C$) as on April 30, 2021 |
Outstanding Shares as on April 30, 2021 |
|
Advantage Oil & Gas Ltd. |
AAV |
613,247,718 |
188,112,797 |
|
Africa Oil Corp. |
AOI |
567,902,540 |
473,252,117 |
|
ARC Resources Ltd. |
ARX |
5,594,799,008 |
723,777,362 |
|
Athabasca Oil Corporation |
ATH |
318,405,235 |
530,675,391 |
|
Baytex Energy Corp. |
BTE |
823,601,946 |
564,110,922 |
|
Bengal Energy Ltd. |
BNG |
34,638,936 |
432,986,694 |
|
Birchcliff Energy Ltd. |
BIR |
920,161,830 |
269,595,188 |
|
Bonterra Energy Corp. |
BNE |
118,234,068 |
33,589,224 |
|
Canacol Energy Ltd. |
CNE |
622,917,473 |
179,515,122 |
|
Canadian Natural Resources Limited |
CNQ |
44,245,363,530 |
1,185,884,844 |
|
Cardinal Energy Ltd. |
CJ |
391,792,218 |
145,108,229 |
|
Cenovus Energy Inc. |
CVE |
19,952,621,032 |
2,053,401,578 |
|
CNOOC Limited |
CNU |
152,775,936 |
1,193,562 |
|
Condor Petroleum Inc. |
CPI |
19,889,295 |
44,198,434 |
|
Crescent Point Energy Corp. |
CPG |
2,814,788,530 |
580,368,769 |
|
Crew Energy Inc. |
CR |
170,668,499 |
156,576,605 |
|
Enerplus Corporation |
ERF |
1,697,118,161 |
256,750,100 |
|
Forza Petroleum Limited |
FORZ |
57,819,722 |
578,197,218 |
|
Freehold Royalties Ltd. |
FRU |
1,058,054,439 |
131,435,334 |
|
Frontera Energy Corporation |
FEC |
615,986,536 |
97,466,224 |
|
Gear Energy Ltd. |
GXE |
128,655,808 |
247,415,016 |
|
Gran Tierra Energy Inc. |
GTE |
300,924,876 |
366,981,556 |
|
Headwater Exploration Inc. |
HWX |
878,127,256 |
195,573,999 |
|
i3 Energy plc |
ITE |
119,009,319 |
700,054,815 |
|
Imperial Oil Limited |
IMO |
26,059,724,803 |
734,076,755 |
|
InPlay Oil Corp. |
IPO |
36,176,006 |
68,256,616 |
|
International Petroleum Corporation |
IPCO |
671,188,581 |
155,367,727 |
|
Journey Energy Inc. |
JOY |
37,840,996 |
44,001,158 |
|
Kelt Exploration Ltd. |
KEL |
514,849,354 |
188,589,507 |
|
Kolibri Global Energy Inc. |
KEI |
22,127,649 |
232,922,625 |
|
MEG Energy Corp. |
MEG |
2,058,300,800 |
303,137,084 |
|
NuVista Energy Ltd. |
NVA |
523,958,776 |
225,844,300 |
|
Obsidian Energy Ltd. |
OBE |
124,989,307 |
73,523,122 |
|
Ovintiv Inc. |
OVV |
7,672,077,076 |
261,043,793 |
|
Paramount Resources Ltd. |
POU |
1,540,600,742 |
134,667,897 |
|
Parex Resources Inc. |
PXT |
2,976,827,201 |
128,588,648 |
|
Perpetual Energy Inc. |
PMT |
13,248,122 |
63,086,296 |
|
Petrus Resources Ltd. |
PRQ |
26,218,760 |
49,469,358 |
|
Peyto Exploration & Development Corp. |
PEY |
884,771,057 |
165,069,227 |
|
Pieridae Energy Limited |
PEA |
69,362,423 |
157,641,871 |
|
Pine Cliff Energy Ltd. |
PNE |
100,727,729 |
335,759,095 |
|
Pipestone Energy Corp. |
PIPE |
308,224,024 |
191,443,493 |
|
Prairie Provident Resources Inc. |
PPR |
5,760,634 |
128,014,081 |
|
PrairieSky Royalty Ltd. |
PSK |
2,943,094,000 |
223,300,000 |
|
Questerre Energy Corporation |
QEC |
85,503,167 |
427,515,836 |
|
Storm Resources Ltd. |
SRX |
387,046,742 |
121,712,812 |
|
Suncor Energy Inc. |
SU |
40,017,315,455 |
1,522,149,694 |
|
Surge Energy Inc. |
SGY |
252,862,209 |
340,574,739 |
|
Tamarack Valley Energy Ltd. |
TVE |
775,485,488 |
301,745,326 |
|
Topaz Energy Corp. |
TPZ |
1,631,679,487 |
112,607,280 |
|
Touchstone Exploration Inc. |
TXP |
362,261,355 |
209,399,627 |
|
Tourmaline Oil Corp. |
TOU |
7,872,332,742 |
296,845,126 |
|
TransGlobe Energy Corporation |
TGL |
141,457,038 |
72,542,071 |
|
Valeura Energy Inc. |
VLE |
40,694,945 |
86,584,989 |
|
Vermilion Energy Inc. |
VET |
1,448,745,762 |
158,853,702 |
|
Whitecap Resources Inc. |
WCP |
3,213,396,243 |
597,285,547 |
|
Yangarra Resources Ltd. |
YGR |
93,063,900 |
85,379,725 |
|
|
|
|
|
The above constitutes a preliminary view and any interest in stocks should be evaluated further from investment point of view.
