


Highlights
- Canadian equities closed higher amid broad sector participation.
- Defensive and property related segments supported overall market direction.
- Market breadth reflected greater advancing activity across listings.
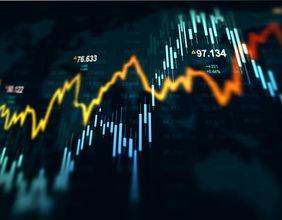
A factual overview of Canadian market activity highlighting sector contributions, benchmark index context, market breadth dynamics, and structural indicators that defined the trading session without interpretive commentary.
The Canadian equity market reflects activity across diverse sectors that collectively indicate broader economic conditions and capital allocation trends. Within this landscape, NFI Group Inc (TSX:NFI) operates as part of the industrial manufacturing space, contributing to sector representation during trading sessions that conclude with overall market advances.
What factors defined the Canadian market session?
The trading session in Canada concluded with equities recording an upward movement, supported by gains across multiple sectors. Property focused segments, including real estate related activities and trusts, showed notable strength, while consumer oriented staples also contributed positively. This combination of sector performance created a supportive environment for the broader market, indicating coordinated participation rather than isolated movement. Such sessions often reflect institutional positioning and sector rotation dynamics that influence overall exchange outcomes.
How did market breadth influence the closing environment?
Market breadth serves as a structural indicator of how widely gains or declines are distributed across listed securities. During the session, advancing equities exceeded declining listings, suggesting that upward momentum was not confined to a narrow group. This type of breadth can signal broad participation across industries and capitalization ranges, contributing to a stable closing environment. Unchanged listings further highlighted balance within the trading activity.
What role did major indices play during the session?
Benchmark indices serve as reference points for market performance and sector weighting. The S and P / TSX Composite Index (TXCX) reflected the overall positive tone, incorporating movements across financials, industrials, resources, and defensive segments. Complementary measures such as the S and P / TSX 60 provided additional perspective on larger capitalization entities, reinforcing the session narrative of widespread participation.
How did sector level activity shape market direction?
Sector level activity remains central to understanding daily equity movements. Real estate related entities, including trusts, demonstrated upward movement that supported the composite direction. Consumer staples, often associated with stable demand characteristics, also recorded gains that added balance to the session. Together, these sectors provided defensive support while other cyclical areas maintained mixed but generally supportive activity.
What patterns emerged among individual listings?
Individual listings within the broader index displayed varied performance, reflecting company specific developments and sector alignment. Some industrial and retail related entities advanced meaningfully, while select listings experienced downward movement. This dispersion illustrates the differentiated nature of equity markets, where individual corporate circumstances coexist alongside macro level trends. Such variation is typical during sessions characterized by broad index gains.
How is volatility interpreted within this context?
Volatility measures provide insight into market sentiment and expectations embedded within derivative instruments. During the session, implied volatility indicators associated with Canadian benchmarks reflected reduced intensity, aligning with the calmer upward movement observed across equities. Lower volatility readings often correspond with orderly trading conditions and narrower intraday fluctuations, reinforcing the session stability.
What relevance do smaller capitalization indices hold?
Beyond primary benchmarks, smaller capitalization measures contribute valuable context regarding emerging and growth oriented listings. Indices such as the TSX Venture Composite Index and the TSX Smallcap Index (TXTW) help illustrate participation beyond established entities. Activity within these measures can signal shifts in attention toward developing enterprises and niche sectors.
How do completion and dividend focused measures add insight?
Supplementary indices further refine understanding of market structure. The TSX Completion Index (TXFO) captures entities outside the primary benchmark, offering a fuller view of exchange activity. Meanwhile, the TSX Composite Dividend Index (TXDC) highlights dividend distributing constituents, adding another layer to sector and style analysis within the Canadian market framework.
How does sector balance support overall market structure?
Balanced participation across defensive and cyclical sectors contributes to resilient market structure. Sessions marked by gains in both property related and consumer essential areas suggest diversified support rather than reliance on a single theme. This balance can moderate volatility and foster continuity in trading patterns, particularly during periods of broader economic assessment.
Why does exchange level participation matter?
Exchange level participation reflects engagement from a wide range of market participants, including institutions and funds tracking benchmark indices. Higher participation across listings enhances liquidity and supports efficient price discovery mechanisms. When advancing activity outweighs declining movement, it underscores collective alignment within the trading community for that session.
