


_09_03_2024_01_03_36_873870.jpg)
On 3rd June 2019 (AEST: 12:24 PM), the benchmark index S&P/ASX200 was trading down by 0.81% at 6,345.6. The S&P/ASX 200 Financials was one of the major sector indices that was dragging the market down, trading down by 0.99% at 6,079.4.
Letâs have a look at the price charts of 3 financial stocks that are down in days trade today.
- Westpac Banking Corporation (ASX: WBC) is a financial services company based in Sydney, Australia. The company was incorporated in 2002 and currently holds the employee strength of more than 32k. It provides services like lending, payments, taking deposits, portfolio management, institutional banking etc.
The stock price has been inching up in the past couple of weeks showcasing a minor uptrend, also the stock price is taking corrections after a good move, which is generally healthy for the rally. Also, the volume of the stock is rising with the uptrend, indicating mass participation, which is a good sign for a healthy trend.
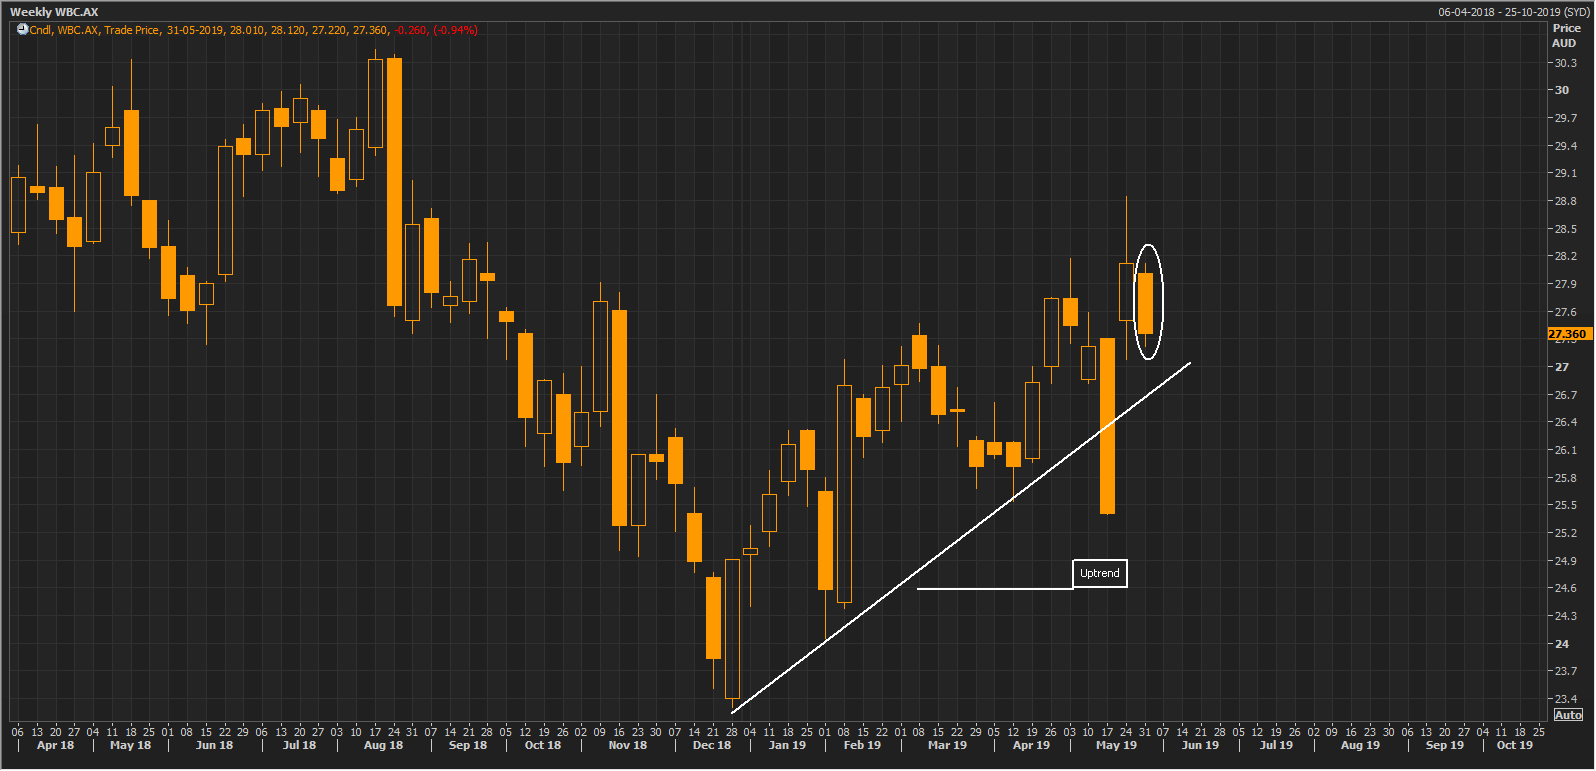 Weekly chart of WBC (Source: Thomson Reuters)
But in the last week ended 31st May 2019, there has been some price correction, wiping out all the gains of the previous week (marker with white ellipse).
The company has a market capitalisation of A$95.6 billion, and the stock had touched a 52-week high and low of A$30.44 and A$23.3 respectively. The stock traded at A$27.160, down by 1.02% as on 3rd June 2019 (AEST: 12:33 PM). The last one-year return of the stock is negative 1.47%, and the YTD return stands at 12.09%.
- Australia and New Zealand Banking Group Limited (ASX: ANZ) is an ASX listed banking and financial services company based in Australia and one of the largest lenders in Australia. It provides banking and financial products and services in Australia, New Zealand, US etc.
On the weekly chart, the stock price is struggling to break past the strong resistance at around A$28.2 â A$28.4. In the recent weeks the stock price witnessed multiple futile attempts (marked with red arrows) to break above this level. Unless this strong resistance is breached, upside is unlikely.
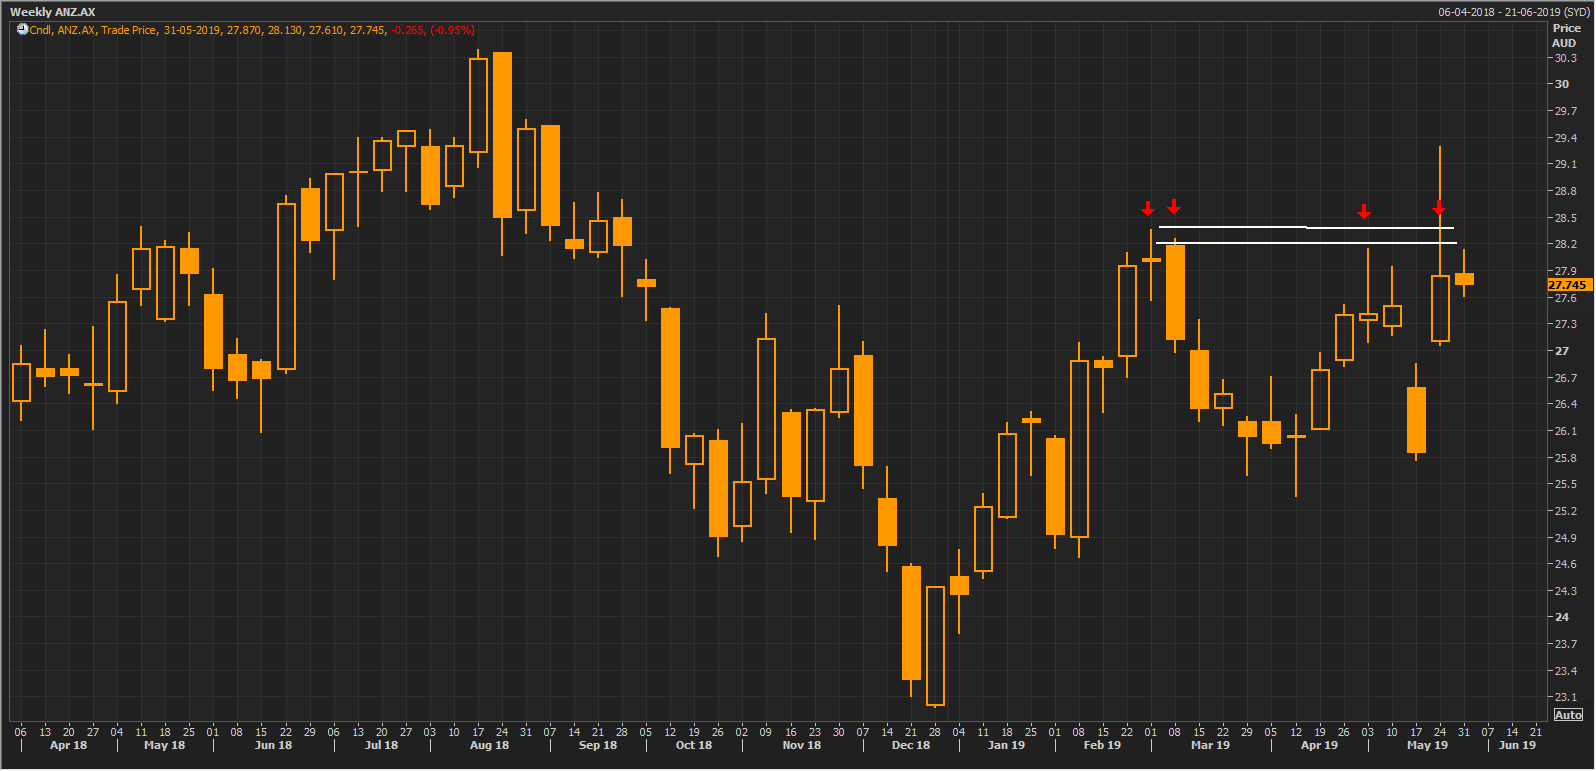 Weekly chart of ANZ (Source: Thomson Reuters)
The company has a market capitalisation of A$78.99 billion, and the stock had touched a 52-week high and low of A$30.39 and A$22.98 respectively. The stock traded at A$27.565, down by 1.13% as on 3rd June 2019 (AEST: 12:33 PM). The last one-year return of the stock is 2.46%, and the YTD return stands at 16.85%.
- National Australia Bank Limited (ASX: NAB) is an ASX listed banking institution based in Australia. The bank has a history of almost 160 years with 30,000 employees and a client base of 9 million.
The stock price has been in a decent minor uptrend in the past few weeks, but on 31st May 2019, the stock formed a Bearish candlestick â Hanging man (marked with white ellipse, this is an indication of profit booking post the upside rally.
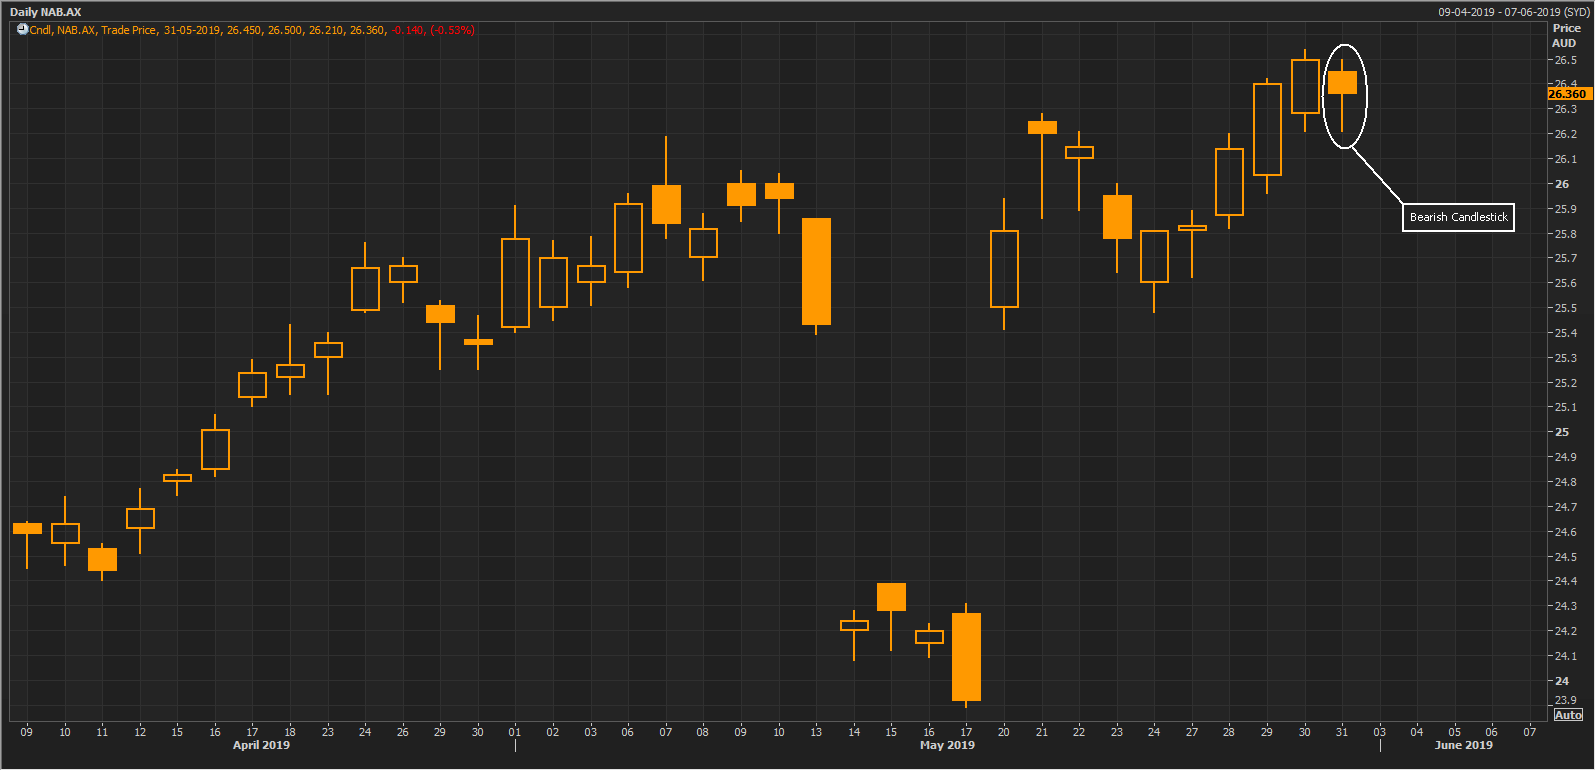 Daily chart of NAB (Source: Thomson Reuters)
The company has a market capitalisation of A$74.47 billion, and the stock had touched a 52-week high and low of A$29 and A$22.52 respectively. The stock traded at A$26.335, down by 0.585% as on 3rd June 2019 (AEST: 12:33 PM). The last one-year return of the stock is negative 1.16%, and the YTD return stands at 12.1%.
Disclaimer
This website is a service of Kalkine Media Pty. Ltd. A.C.N. 629 651 672. The website has been prepared for informational purposes only and is not intended to be used as a complete source of information on any particular company. Kalkine Media does not in any way endorse or recommend individuals, products or services that may be discussed on this site. Our publications are NOT a solicitation or recommendation to buy, sell or hold. We are neither licensed nor qualified to provide investment advice.
