


Summary
- The surge in S&P/ASX 200 now seems to be shifting the table in favours of bulls with many stocks on the exchange reaching multi-period highs since the onset of the June 2020 quarter.
- While ASX-listed gold stocks have contributed a significant tranche in the recovery of S&P/ASX 200, capturing market attention, many stocks on the exchange such as Objective Corporation Limited (ASX:OCL), Resimac Group Limited (ASX:RMC) are now stealing the show over a strong financial year and sentiment splash in the stock price.
- OCL hits a record high post witnessing a 22 per cent increase in NPAT for FY2020.
- RMC attempts volatility breakout and gains momentum after reporting a 79 per cent jump in NPAT for FY2020.
S&P/ASX 200 Index is under a recovery mode and with the surge in the benchmark index, market sentiments seem to be shifting the table in favour of bulls. While a considerable recovery in S&P/ASX 200 index is due to the surge in the stock price of ASX-listed gold stocks, many stocks on the exchange such as Objective Corporation Limited (ASX:OCL), Resimac Group Limited (ASX:RMC) are now stealing the show amidst strong recovery in the stock price over a strong FY2020.
Also Read: S&P/ASX 200 - A Rising Tide Bound For 8,000 Mark?
Objective Corporation Limited (ASX:OCL)
The Company reported revenue of $70 million for FY2020, up by 13 per cent against the previous corresponding period (or pcp), leading to a 22 per cent growth in EBITDA against pcp at $17.2 million.
- The Net Profit After Tax (or NPAT) for the period soared by 22 per cent against pcp to stand at $11.0 million.
- OCL stated that the overall recurring revenue increased to 75 per cent of total revenue during the period, as compared to 70 per cent witnessed in pcp.
- Also, the perpetual (upfront) licence fee revenue for the period represented less than 7 per cent of total revenue.
- Furthermore, the annualised recurring revenue grew by 22 per cent against pcp to stand at $56.6 million (as on 30 June 2020).
The Company suggested that the annual recurring revenue witnessed a growth in all core subscription software products; including,
- ECMaaS – witnessed a growth of 101 per cent over FY2019, Connect – witnessed a growth of 34 per cent against pcp, Keystone – witnessed a growth of 8 per cent against pcp, Trapeze – witnessed a growth of 51 per cent, and AlphaOne – witnessed a growth of 49 per cent.
During the period, OCL invested $15.7 million in R&D, representing 22 per cent of revenue, and the Company fully expensed all R&D expenditure in the year to reach the net profit figure.
The market seems to be cherishing over an impeccable performance with the stock contouring a record high of $12.50, and currently trading at $12.050 (closing 28 August 2020).
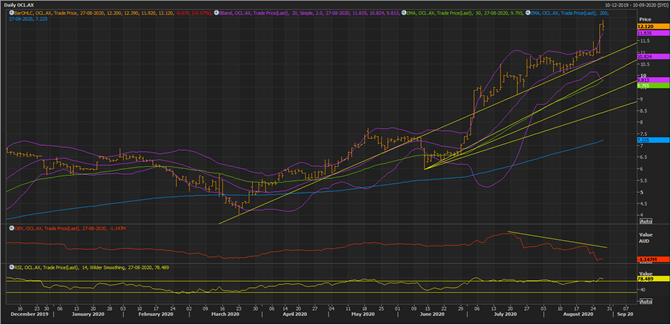
OCL Daily Chart (Source: EODHD/Others Eikon Thomson Reuters)
On following the daily chart, it could be seen that the stock is currently trading in an uptrend with prices trading above the 50-day exponential moving average and 200-day exponential moving average (or EMA).
- During the trading session on 26 August 2020, the stock breached above the +2 Standard Deviation of the 20-day simple Bollinger band to give a volatility breakout. At present, the stock is holding the volatility breakout, which could seed bullish sentiments.
- However, the On Balance Volume (or OBV) is showing a divergence with the price action, suggesting that the recent rally in the stock is on weak volumes.
- The divergence of the stock price action with its OBV, coupled with an overbought situation – inferred from the 14-day Relative Strength Index (or RSI), is reflecting exhaustion of the bull rally.
- If the stock takes a correction, the upward sloping trend line could act as primary support, which is overlapping with the mean value of the Bollinger band; thus, it would be decisive in nature.
- The major support for the stock is at the 1/3 fraction of the Fibonacci fan, which is overlapping with the 50-day EMA and -2 Standard Deviation of the Bollinger band.
Resimac Group Limited (ASX:RMC)
The non-bank mortgage lender – Resimac reported a normalised NPAT of $55.7 million for FY2020, up by 79 per cent against pcp.
- The net interest income soared by 60 per cent against pcp to stand at $188.6 million. Apart from strong growth in normalised NPAT, the Statutory NPAT grew by 19 per cent to stand at $56.0 million.
- The home loan settlements for the period surged by 30 per cent against pcp to stand at $4.7 billion while assets under management increased by 11 per cent against pcp to stand at $14.9 billion.
Furthermore, earnings per share climbed by 17 per cent against pcp to reach 13.75 cents a share, leading to a return on equity (or ROE) of 25.5 per cent, up by 820bps against pcp.
Also, the Company distributed a full-year dividend of 3.0 cents a share, up by 20 per cent against pcp.
After witnessing ~ 76.47 per cent from its previous peak of $1.700 (intraday high on 26 February 2020) to the level of $0.400 (intraday low on 19 March 2020), the stock has now gained substantial momentum.
RMC has been in a consistent rally from the level of $0.400 to the present high of $1.395 (as on 26 August 2020), marking over threefold increase in the stock price on ASX.
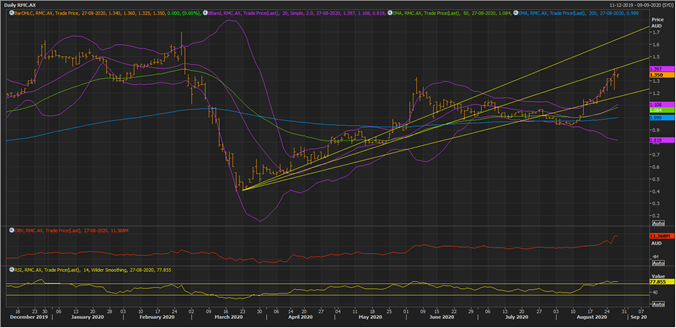
RMC Daily Chart (Source: EODHD/Others Eikon Thomson Reuters)
On following the daily chart, it could be seen that the stock is now transitioning into a primary trend with prices now trading above the 50- and 200-day EMA.
- RMC attempted a volatility breakout on 26 August 2020 with prices breaching the +2 Standard Deviation of the 20-day simple Bollinger band; however, failed to sustain the same.
- At present, the stock is testing the resistance offered by 2/3 fraction of the Fibonacci fan, which is overlapping with the +2 Standard Deviation; and,
- A break and sustain above the same could seed further bullish sentiment.
- The price and OBV are moving in tandem, reflecting that the recent rise in price has been supported by high volumes.
- The primary support for the stock is that 3/3 fraction of the Fibonacci fan, which is falling near the -2 Standard Deviation of the Bollinger band and 50-day EMA; thus, is decisive in nature.
