


Dividend Discount Model (DDM) is a model, which is used to calculate the fair value of a stock price. This model is based on a theory that the current share price of the company is nothing but the summation of all the expected future dividend payments that the company is going to make. It is to be noted that while calculating the fair value of a stock, all the future expected dividend payments of the company are discounted back to their present value using an appropriate discount rate.
In case the value obtained from this model is higher than the current stock price of the company, the stock is considered undervalued. And if the value obtained is lower than the present value of the stock, then that stock will be considered overvalued.
In order to determine the fair value of a stock using the DDM method, one needs to first calculate the expected future dividends. The expected future dividends can be calculated through a growth rate. For example, if a company has a growth rate of 10% for dividend payment and it has paid a dividend of $10 per share last year, it can be assumed that this year, the company will pay a dividend of $10.10 per share. Once the future dividend payments are calculated, one needs to determine the present value of the dividends by using a discounting factor. After calculating the present value of all the expected future dividend payments, one can easily do the valuation of a stock.
Generally, the growth rate for paying dividends keeps on changing. To evaluate a stock using the DDM method, investors should look for companies with respectable dividend history. Letâs take a look at a few ASX-listed companies, which could be a good prospect for determining valuation through the DDM method.
Tabcorp Holdings Limited (ASX:TAH)
A world-class diversified gambling entertainment company, Tabcorp Holdings Limited (ASX: TAH) has recently paid a fully franked interim dividend of 11.0 cents per share. Tabcorp Holdings is known for a track record of consistent dividend payment. TAHâs share price was up 1.747% during todayâs trading session.
Recently, in the first half of FY19, the company delivered $24 million in EBITDA from cost synergies and business improvements and now is all set to achieve $55 million of EBITDA in FY19.
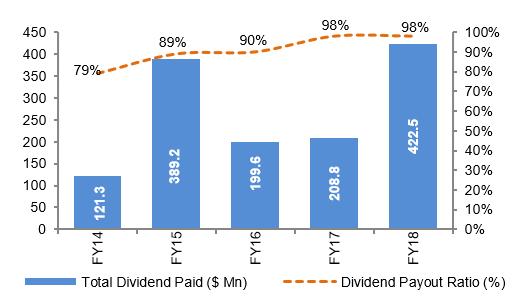
Dividend and Dividend Payout Ratio Trend (Source: Company Reports)
For the financial year 2019, the company intends to have a dividend payout ratio of 100% of NPAT before significant items, amortisation of the Victorian wagering and betting licence, as well as purchase price accounting.
On the stock performance front, in the past six months, the stock of TAH has provided a return of 7.51% as on 18th June 2019. TAHâs stock is trading at a PE multiple of 54.520x, with a dividend yield of 4.59%. Its 52 weeks high price stands at $4.990 and 52 weeks low price at $4.090, with an average volume of ~5,782,226.
At market close on 19th June 2019, TAHâs stock was trading at a price of $4.660, with a market capitalisation of circa $9.25 billion.
National Australia Bank Limited (ASX:NAB)
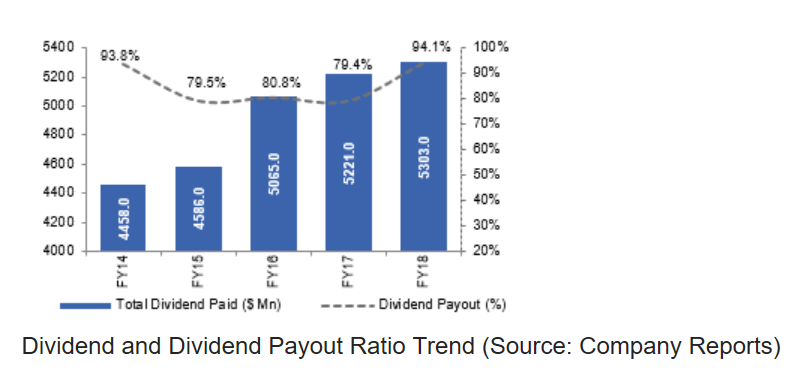
Australiaâs leading bank, National Australia Bank Limited (ASX: NAB) mainly provides personal banking and business banking services to its clients. The bank is known for paying healthy dividends regularly to its shareholders.
For the first half of FY19, the bank declared an interim dividend of 83 cents per share, representing a dividend payout of 77% of cash earnings. Last year, the bank returned $5.3 billion in dividends to more than 584,000 shareholders while maintaining a payout ratio of 82.6%.
During the first half, NAB reported revenue growth of 1.4% on pcp while its net interest margin was down by 7 basis points.
Following the scrutiny by the Royal Commission, NAB is now taking actions to deal with the broader issues while following the recommendation of the Royal Commission. The bank has progressed rapidly in remediating customers and now is taking all precautionary measures to deal with its customers.
The bank is currently in the middle of its three-year transformation program and the benefits of it have slowly started to hit the surface, as can be seen that the expenses in 1H19 have reduced by 2% as compared to previous half. This is just a beginning, as NAB expects to accomplish the target of around $1 billion cumulative cost savings by the September month of next year. These cost savings will help NAB to further improve its financial performance.
On the stock performance front, in the past six months, the stock of NAB has provided a return of 15.52% as on 18th June 2019. NABâs stock is trading at a PE multiple of 13.030x, with a dividend yield of 6.81%. Its 52 weeks high price stands at $29.00 and 52 weeks low price at $22.520, with an average volume of ~7,213,547. NABâs share price was up by 0.412% during todayâs trading session.
At market close on 19th June 2019, NABâs stock was trading at a price of $26.830, with a market capitalisation of circa $75.12 billion.
Magellan Financial Group Limited (ASX:MFG)
A leading investment management company, Magellan Financial Group Limited (ASX: MFG) experienced net inflows of $264 million in the month of May 2019. As at 31 May 2019, the companyâs total funds under management (FUM) stands at $82,759 million. In the six months to 31st December 2018, the companyâs average funds under management increased by 35% to $72.1 billion and its statutory net profit after tax increased by 225% to $173.5 million. For the half-year period, the Board has determined an interim dividend of 73.8 cents per share (75% franked), up 66% from 2018 interim dividend.
In FY2018, the company paid fully franked dividends of $1.345 per share, which compares with $0.856 in FY17.
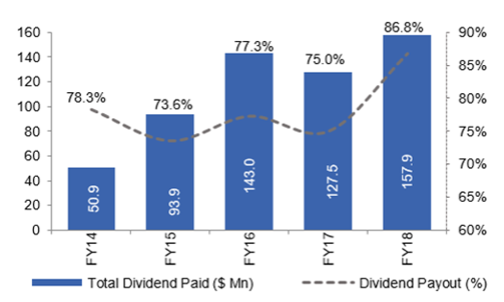
Total Dividend Paid and Payout Ratio Trend (Source: Company Reports)
On the stock performance front, in the past six months, the stock of MFG has provided a return of 100.74% as on 18th June 2019. MFGâs stock is trading at a PE multiple of 25.820x, with a dividend yield of 3.35%. Its 52 weeks high price stands at $50.990 and 52 weeks low price at $21.800, with an average volume of ~585,432. MFGâs share price was up 3.807% during todayâs trading session.
At market close on 19th June 2019, MFGâs stock was trading at a price of $50.720, with a market capitalisation of circa $8.65 billion.
The abovementioned companies have consistently provided good returns to their shareholders in terms of dividends. In order to determine the fair value of these stocks, one needs to consider the growth rate at which the future dividends payments will be made and the discount factor, which will be used to calculate the present value. Only after considering all these factors, one can properly use the DDM method for stock valuation.
Disclaimer
This website is a service of Kalkine Media Pty. Ltd. A.C.N. 629 651 672. The website has been prepared for informational purposes only and is not intended to be used as a complete source of information on any particular company. Kalkine Media does not in any way endorse or recommend individuals, products or services that may be discussed on this site. Our publications are NOT a solicitation or recommendation to buy, sell or hold. We are neither licensed nor qualified to provide investment advice.
