


Summary
- The Consumer Price Index is connected with the price of goods, as well as inflation and deflation.
- China has a 2.7% rise in the CPI as of July 2020, due to increased food costs.
- In a March-June 2020 Quartal period, Australia faced a 1.9% decrease in the CPI.
- Manufacturing in China took a 2.4% hit, caused by the coronavirus pandemic.
- Even though Chinese households usually consume a lot of wheat, 2020 has shown a significant decrease in grain demand.
- Childcare, education, and fuel have seen the biggest price drop, whereas furniture, food and alcohol have seen the biggest price increase in Australia.
Due to the coronavirus pandemic, countries around the world are experiencing a rise in prices of goods. Apart from the price increase, many territories are printing more money, resulting in currency inflation.
Both situations mentioned above are connected with the calculation of The Consumer Price Index (CPI), with some economies experiencing a much bigger increase than expected.
When it comes to the second-biggest economy in the world, the Chinese economy is currently facing a 2.7% rise in the CPI (July 2020), because the food costs are now higher than before the pandemic. On the other hand, Australia’s All groups CPI decreased by 1.9% in March to June 2020 quarter.
RELATED: Australia enters deflation after CPI suffers biggest quarterly slump
What is CPI?
The Consumer Price Index, or CPI, is a measurement of the prices of goods and services, analysing their weighted average. Some of the examined prices include food and non-alcoholic beverages, furniture, tobacco, transportation and similar. Change to the CPI is measured in percentages.
Cost of living is directly connected to the CPI because it examines the change in prices.
Another frequent use of the CPI is to oversee inflation and deflation levels.
It is important to mention that the CPI is not used for costs made by tourists, and it does not consist of savings and investments.
China’s Economy
National Bureau of Statistics of China is the institution responsible for analysing the country’s CPI.
As already mentioned, China’s CPI has seen a rise of 2.7% in July, higher inflation than previously seen in June (2.5%). Even though there was an estimate of a 2.6% increase, the Chinese economy is still not doing as bad as previously thought.
The novel pandemic caused setbacks in the manufacturing sector in China, but as of July 2020, the situation was slightly better as a result of a slow recovery (a 2.4% decrease compared to a 3% decrease in June).
However, China’s already shaken society is experiencing higher food costs (especially pork) as an outcome of the pandemic.
After measuring the CPI for nutrition group, there was a significant 13.2% cost increase witnessed within the sector. The price of pork went up by 85.7% overall, and compared to the statistics in June, it rose by 10.3%. The recent floods that affected China also caused problems in pig transportation, which led to a small supply of pig goods.
Alongside the pork cost increase, farmers are experiencing a grain overabundance. It is estimated that they hold ~20-30% of the total grain production in their home silos.
The consumption of wheat is usually very high in China. However, new research shows there was a 17.2% decrease in the grain purchase in June and July, according to China’s National Food and Strategic Reserves Administration. Due to lower demand, farmers decided that it was better to keep the supply for themselves, rather than selling to the Chinese government.
To know about China’s exports data and the country’s relations with Australia, click here.
Consumer Price Index in Australia
Australian Bureau of Statistics (ABS) is the institution responsible for measuring the CPI of Australia.
Compared to China, the Australian economy did not take as big of a hit as the Chinese economy did. ABS measured the weighted average of eight major cities, concluding that there was a 1.9% decrease for all CPI groups in May to June quarter.
At the beginning of the pandemic (April 2020), Prime Minister Scott Morrison introduced a free childcare scheme for families. That move led to a 95% price fall in the childcare sector and is the most significant change recorded from April to June.
Many Australians were pleased with a price drop of fuels (a 19.3% fall), as most Aussies chose to drive their own vehicles rather than taking the risk of catching COVID-19 on crowded public transport.
Children around the country were urged to stay at home and not go to schools, which resulted in a 16.2% drop in education costs.
The biggest price increase was seen in furniture prices (3.8%) and goods that include food, alcohol, tobacco and similar (4.5%).
For other increase and decrease in costs, please see the table below:
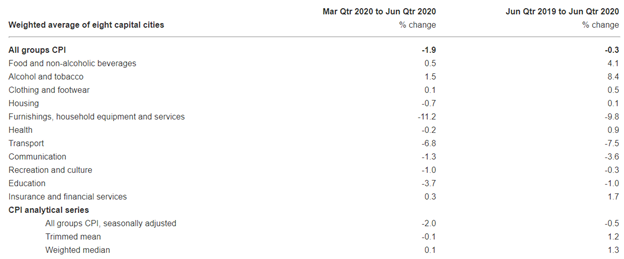
Source: Australian Bureau of Statistics
ALSO READ: Impact of Coronavirus on Australian Economy and Way Forward
Optimistic outcome
The coronavirus pandemic took a lot from people and their countries, not even leaving rich countries like China and Australia. Both countries experienced setbacks in specific sectors, but the outlook seems to be optimistic, as long as the countries do not experience more changes caused by the possible second wave of the coronavirus.
It was thought that the inflation rates in China could affect the already problematic trade relationship with Australia, but as China experienced a 3.2% growth in the second quarter, Australian experts are optimistic about the business, given the new data.
